How to use this site
Feature by feature: what it is worth to you, how to use it properly, and the small habits that make it pay. Read it top to bottom once, then come back to whichever section you are standing in. If you want the ideas behind the app first, read the explainer; if you want the exact definition of a number, the manual has it.
Nothing here is investment advice. The site measures and shows; what you do with it is yours.
00A daily routine, if you want one
You do not have to use everything. Most people settle into one of these three loops; each takes a few minutes and touches four or five features. Pick one, and let the rest of this page fill in the detail.
The five-minute open
- Markets, window
1d, sort by vs tape. - Glance at the 1d movers chips and the action strip's HEATING list.
- Calendar: who reports today, what macro prints today — open the Setups strip for anyone reporting this week.
- Before the cash open: Gaps — what the perp is pricing, and how much of it usually holds.
- Bell: anything fired overnight? BOW / Pulse: any new leg on 1D or 3D?
- Open one name, write one line in Notes.
The positioning read
- Funding heatmap, 8h: who is paying, and is it building or fading?
- Markets, sort by Squeeze and by OI/Vol.
- Sectors flow map: which theme is being bought with conviction.
- Shorts: is the stock's short side building under a crowded perp?
- Correlation, then Book: is the trade you like already the trade you have?
- Set a rule on the level you care about.
The weekly review
- Sessions: is the overnight edge still there net of funding?
- Signals: search your favourite names' claim histories.
- Signals › Calls › Weekly recap: what the desk called, and how it closed.
- Your own profile on the leaderboard: where is your edge, and do you bank winners and ride losers?
- Notes: re-read what you thought, with the move since.
- Trim the watchlist. Save the layout.
01The Markets table
One screen that answers "what is the tape doing, and which names are doing something different" — with every number pre-computed so the page is instant and everyone sees the same thing.
- Click STOCKS or CRYPTO at the top left.
- Click a window: 1d for today, 7d for the week.
- Click a column header to sort. Try VS TAPE.
- Click Filters → type 5 in 24h Vol → the tiny names disappear.
- Click a row to open that name.
That is the whole loop. Everything else on this page is detail.
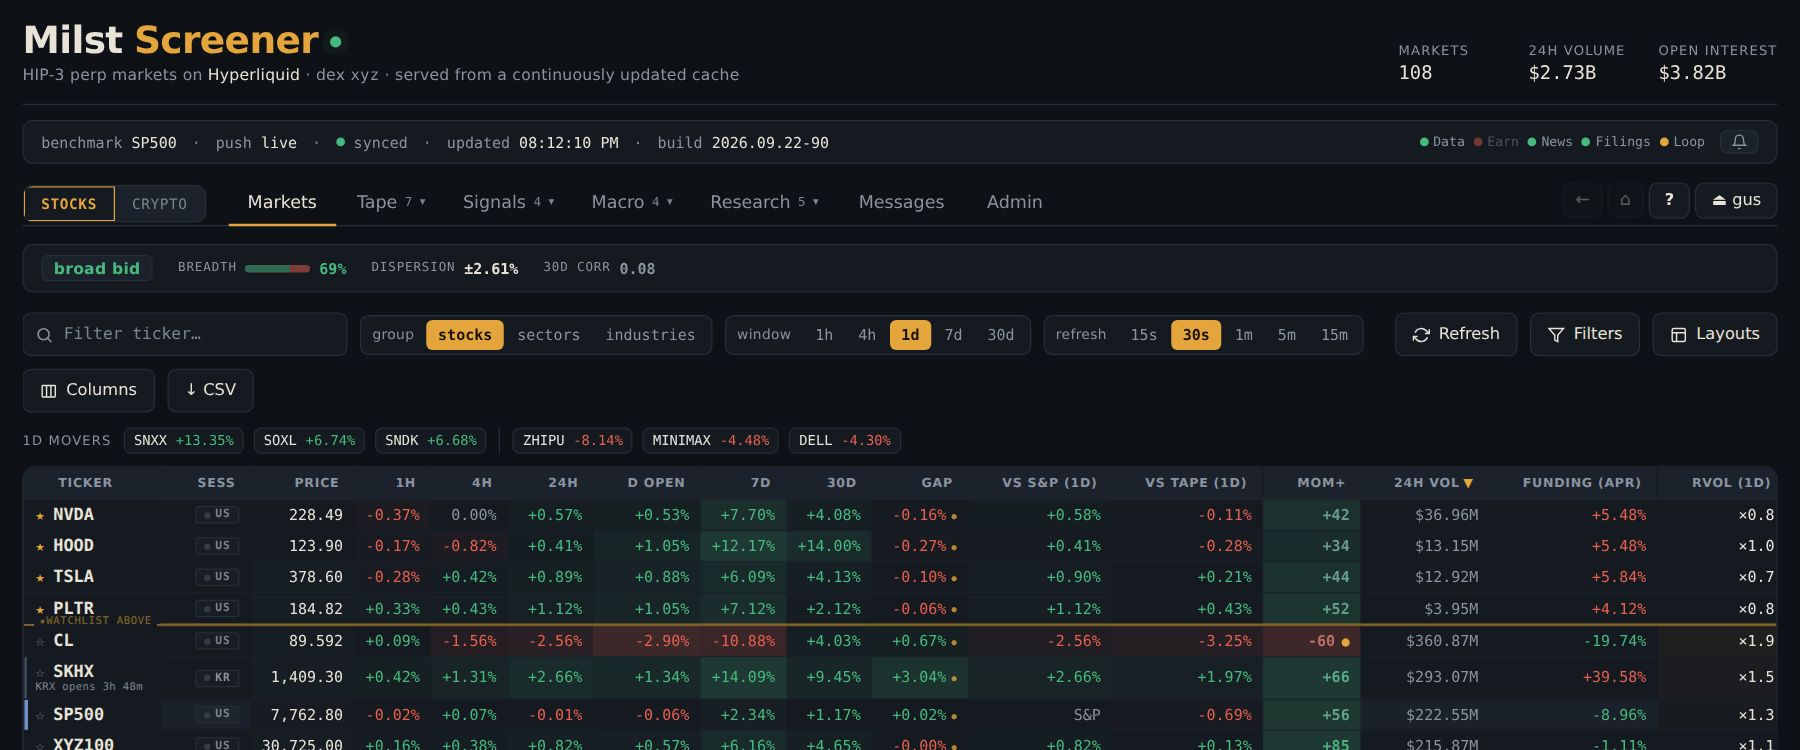 1234567891011
- 1Stocks | Crypto scope
- 2window
- 3click a header to sort
- 4Filters
- 5Layouts
- 6Columns
- 7↓ CSV
- 8type to filter tickers
- 9status line
- 10? help
- 11🔔 bell
- Pick your scope first. Stocks | Crypto at the top. Nothing carries across the wall, so if a column looks empty, check which side you are on.
- Set the window (
1h · 4h · 1d · 7d · 30d). Every column that says "over the window" moves together: vs S&P, vs tape, ΔOI, Squeeze, Carry, Avg Range, RVOL. Use1dfor the day,7dfor the week's story,30dfor positioning that has had time to build. - Sort by clicking a header. Click again to flip. The most useful sorts are not price changes: try vs tape (who is strong on a weak day), RVOL (who is being traded unusually), ΔOI (where money is arriving) and Squeeze.
- Filter the noise. Filters holds volume and open-interest floors (in millions;
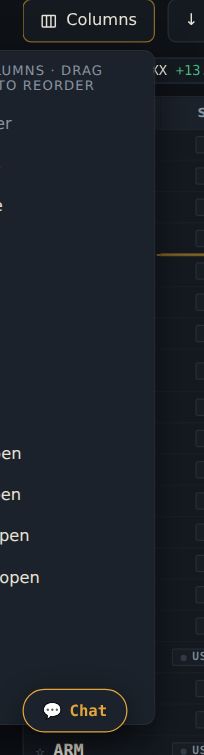
500kand2.5bwork too). A floor of a few million in 24h volume removes the names you could not exit at size. - Show the columns you actually use. Columns shows, hides and drag-reorders. Several useful ones are hidden by default: the moving averages, VWAP, the intraday opens, DownCap. Where the feeds are open to you, the newer columns live here too: Short float and Short vol (see Shorts), Consensus σ (see Consensus) and OI cap — a market at its open-interest cap, where orders that add open interest are refused.
- Hover before you conclude. Every cell tells you its inputs, its window and its sample size. A shaded cell scales with the size of the move, so a wall of deep red 7d cells is the breadth read.
- Export with ↓ CSV — you get exactly the rows, columns, sort and filters on screen.
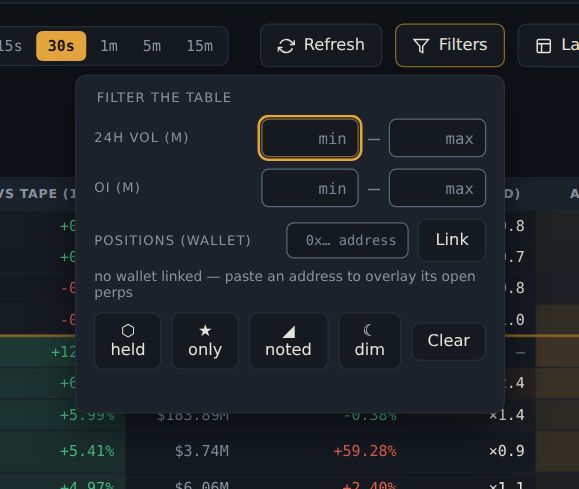 123456
- 1volume floor (millions)
- 2OI floor
- 3link a wallet (public address)
- 4★ only
- 5◢ noted
- 6⬡ held
5 for $5M. The three buttons at the bottom narrow the table to your starred names, your noted names, or the names your wallet holds.| window | vs S&P | vs tape | ΔOI | squeeze | carry | RVOL | 24h (fixed) | funding (now) |
|---|---|---|---|---|---|---|---|---|
| 1d | +1.4% | +2.1% | +3% | 4 | 0.12 | 1.1× | +2.6% | +14% |
| 7d | −0.8% | +5.9% | +18% | 37 | 0.31 | — | +2.6% | +14% |
Underlined cells follow the window selector. The 24h change and the live funding rate do not — they are what they are. RVOL shows a dash on 7d/30d rather than a fake number.
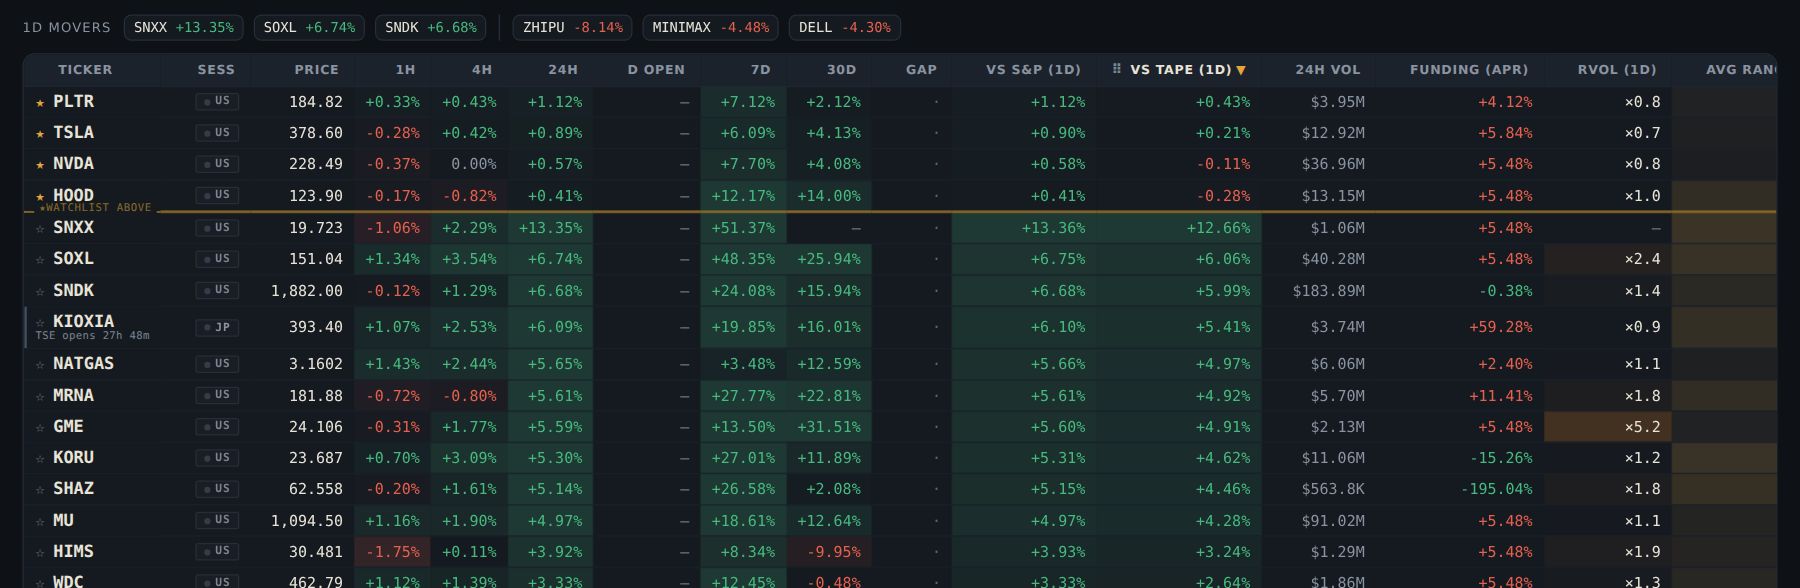 12
- 1sorted by vs tape
- 2★ star = watchlist
- group → sectors / industries. The same table with one row per sector. Each cell is the weighted average of the rows you are showing — and Best · Worst tells you whether the sector number is everyone or one name dragging the rest. Click a group row to drill into its members.
- The action strip under the table (click ▸ Action). HEATING is what is starting: acceleration confirmed by flow. COOLING is what is still ahead of the tape but has stopped moving — with a high momentum score that is the take-profit read. STRONGEST BID is who got bought on the dip in the last four hours.
7d, sort vs tape
descending, volume floor 5. The top of the table is what held up when the tape did not.
Now hover the ΔOI cell on the top three: longs+ means new money confirmed it,
squeeze means it was shorts covering — a different trade entirely.It is 9:45 ET and the tape is down 1.5%. Sorting by 24h just shows you who fell least. Instead you set the window to 1d and sort vs tape descending.
Three names are green against a red tape. The top one, HOOD, also shows RVOL 2.4× and ΔOI +9% longs+: it is being bought, with size, while everything else is sold.
So: that is the one name you open. The action strip's HEATING list agrees. You have found the day's relative-strength candidate in about forty seconds, without a single hover.
02The ticker drawer
Everything the site knows about one name, on one scroll, so you stop tab-hopping to build a picture.
- Click any row in the Markets table.
- Read the top: METRICS. Red funding = the crowd is long and paying.
- Scroll: NOTES is yours. Click + note to write one.
- Keep scrolling: candles, event risk, news, the signal record.
- Press Esc to close.
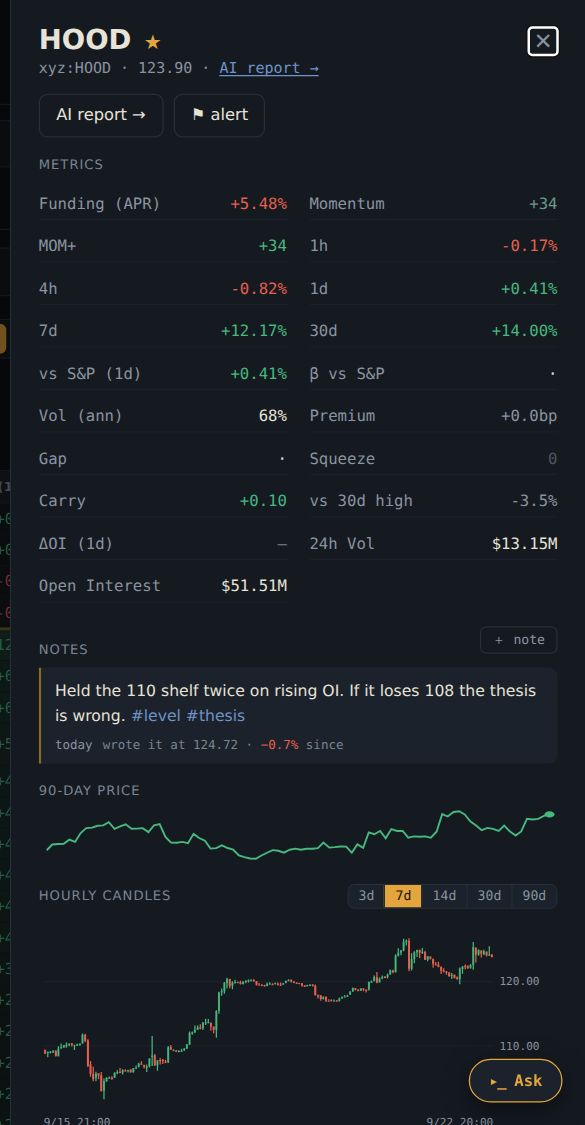 1
- 1the drawer
- Open it by clicking a row, pressing Enter on a highlighted row, or Ctrl/⌘+K and typing the ticker.
- Read it top to bottom. Header and event risk first (is there an earnings print or a macro event inside your horizon?), then where the 30d return happened (off-hours vs cash session), then the metrics grid, then candles and the OI / funding history, then news and the signal record.
- Use the focus chip. Opening a name sets the ◎ focused ticker. Now Trend, Charts, Report and Correlation open on that same name — click the chip in the status line to reopen the drawer from anywhere.
- Write while you are there. The Notes panel sits above the charts. That is on purpose: everything else in the drawer is the server's read; the note is yours.
- The 30d split is the underrated panel. A name that made all its return overnight is a different hold from one that made it during the session — and the funding you pay to hold overnight is right beside it.
- Co-movers and hedges are computed on 90 days of daily returns. Before you add a name, check whether it is a co-mover of something you already hold.
- The signal record is the out-of-sample history of every claim the engine made on this name. A name with a poor record is a name where the engine's flags deserve less weight.
- Pre-earnings setup. A name reporting within five sessions gets its setup card in the drawer — reaction study, positioning into the print, run-up, implied vs typical, and one verdict line. See Calendar.
- Every section header has a ⤴. Share the metrics, the reaction study, a sparkline or the candles straight into a conversation.
- The URL follows you.
#t=NVDAin the address bar is a shareable link straight to this drawer.
You open HOOD from the table. Event risk says it reports Thursday after the close; the reaction study shows a median move of 7.1% the next session, 2.3× its usual range. The 30d split says most of this month's return came off-hours.
So: any position is sized for a 7% gap, not a 3% day. You decide either to close before Thursday, or to hold half size through the print on purpose. Either way the decision was made before the trade, with numbers, in one scroll.
03Watchlist and saved layouts
The table shaped the way you read it, on every device, without redoing it each morning.
- Click the ☆ next to a ticker. It turns ★ and jumps to the top.
- Arrange the table how you like (sort, window, columns).
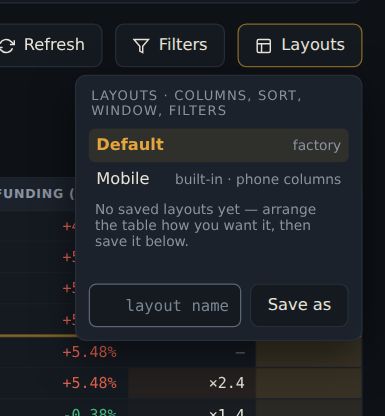
- Click Layouts → save → give it a name.
- Next time: click Layouts → click the name.
- Star names with the ★ beside the ticker. Starred names float to the top of the table; ★ only in Filters shows nothing else. The watchlist follows your account, so your phone has it too.
- Arrange the table once — columns, order, sort, window, volume/OI floors, ★-only.
- Layouts → save, and give it a name that says what it is for: positioning, open, swing.
- Switch layouts from the same menu. A • beside the active name means you have drifted from what you saved; save again or switch back.
- Make a layout per question, not per day. A "positioning" layout with Funding, ΔOI, Squeeze, OI/Vol and Carry; a "strength" layout with vs tape, RVOL, DownCap and Momentum. Switching layouts is faster than re-sorting.
- Saved layouts sync; the active one does not. Your phone can run its own layout while the desktop runs another — that is deliberate, not a bug.
- New columns are never dropped from an old layout. When the app adds a column, your saved view gains it (hidden if it is hidden by default) rather than silently losing it.
- The ticker search box is not part of a layout — it is meant to be typed and cleared.
 1
- 1Layouts menu
 1
- 1show / hide / drag to reorder
You actively follow twelve names. You star them. Then you save two layouts: positioning (Funding, ΔOI, Squeeze, OI/Vol, Carry) and strength (vs tape, RVOL, DownCap, Momentum).
Monday on the phone: ★ only plus the positioning layout is your whole book's crowding on one screen. At the desk, the strength layout is where the ideas come from.
So: no more rebuilding the table every morning, and the phone stays on its own compact layout while the desktop keeps the wide one.
04Trend
Separates "it went up" from "it is trending" — and points at the pullback, which is where an entry with a defined risk actually lives.
- Open Tape → Trend.
- Pick long or short at the top.
- Look for 4/4 or 3/4 with a RETEST badge.
- Prefer a small age (a few days) over a big one.
- Click the chart button on the row to see the pullback.
- Pick a side — the long board or the short board.
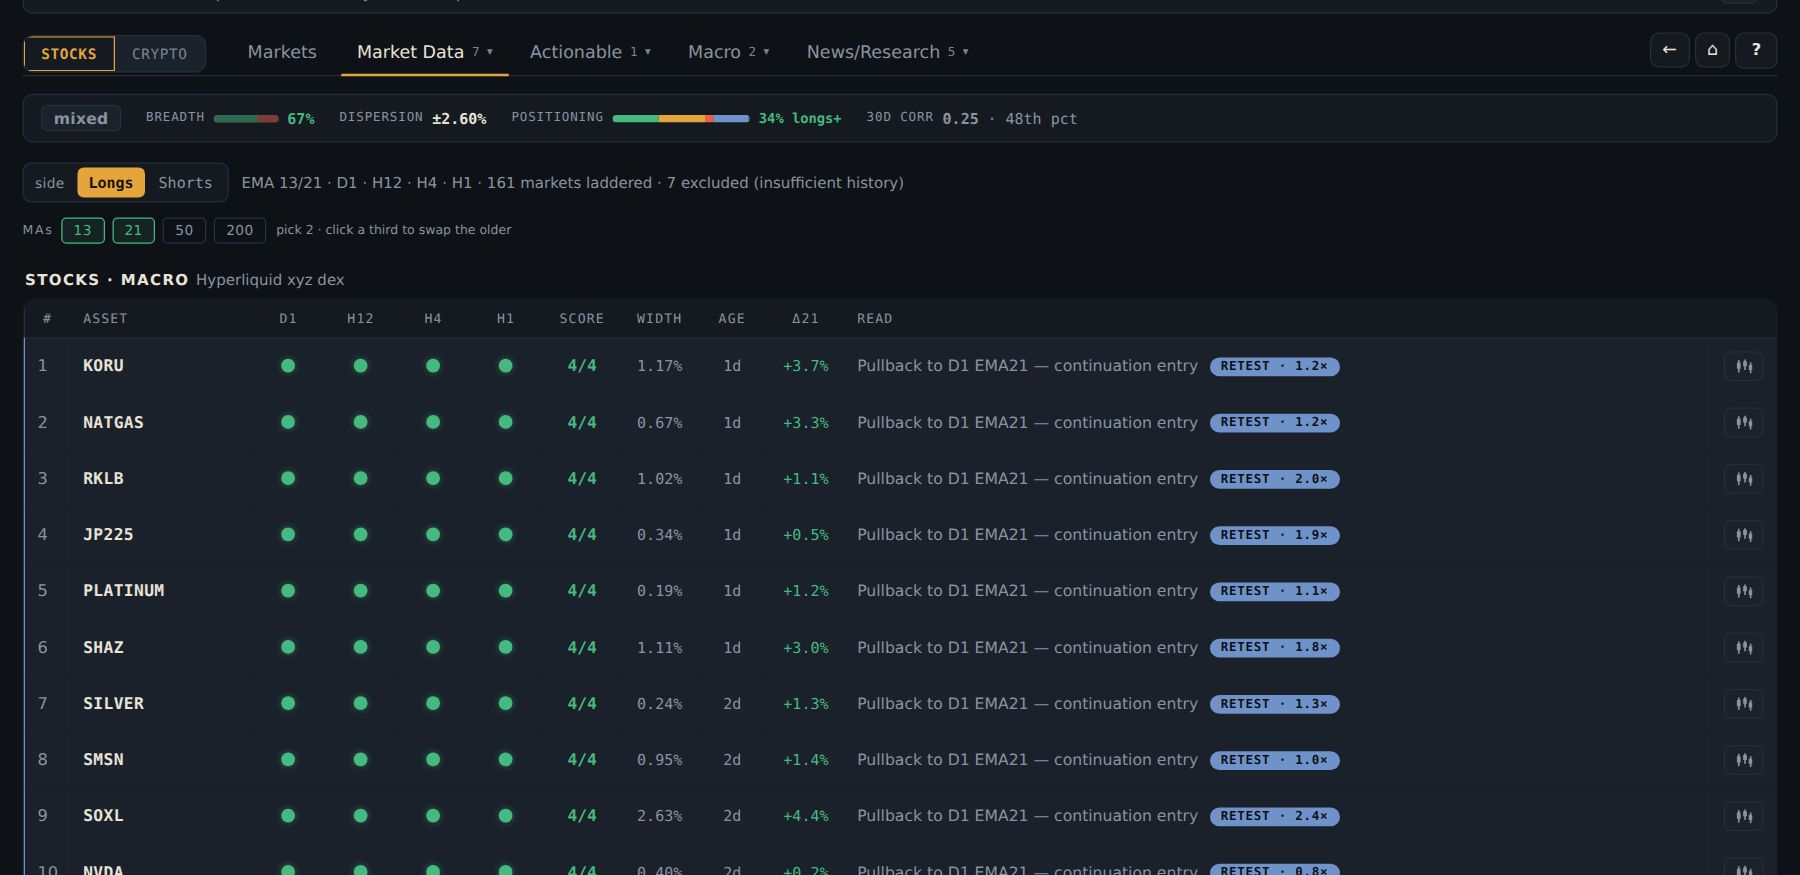
- Read the score. Each name gets a rung per timeframe (daily, 12h, 4h, 1h); green means price is above a stacked EMA 13/21 ribbon on that rung. 4/4 is an established trend on every timeframe; 2–3/4 usually means the higher timeframes lead and the lower ones are pulling back.
- Look for RETEST. The badge means price just probed into the ribbon while the close held the right side — the continuation pullback. The volume multiple beside it tells you whether the level is being fought (≥2×) or quietly respected (~1×).
- Check Width and Age. Two 4/4 trends are not the same trade when one rides a hair-thin ribbon and the other a wide one. Age is how many days the daily rung has been stacked — a day-3 trend is an entry, a day-40 trend is a chase. The board ranks fresh-first for exactly that reason.
- Click the chart button on a row to see the rung with the ribbon and the retest zone drawn at the ladder's own levels.
 1
- 1long / short side
- Δ21 is the live distance from the hourly EMA21 — your proximity-to-entry number.
- The badge you see is the same condition that becomes a signal in the ledger. The board and the signal cannot disagree.
- A name missing a rung (too little history) is excluded, not guessed — the header counts them.
NVDA sits on the long board at 3/4, RETEST · 1.1× vol, age 4d, Δ21 −0.3%. The daily, 12h and 4h are stacked; the hourly just dipped into the ribbon and held.
Four days old means it is an entry, not a chase. 1.1× volume means nobody is fighting the level. Δ21 says price is a third of a percent from the hourly EMA21 — the level you would risk against.
So: you buy near the hourly EMA21 with the void just under the ribbon. A defined-risk pullback in an established trend, found in one glance, rather than a day-40 trend you would be chasing.
05Charts and Treemap
Charts: compare shapes across names or across timeframes, draw your levels once and see them everywhere, and run any indicator — a TradingView script you already use included — on the same candles. Treemap: the whole universe in one glance, sized by what matters to you.
- Open Tape → Charts.
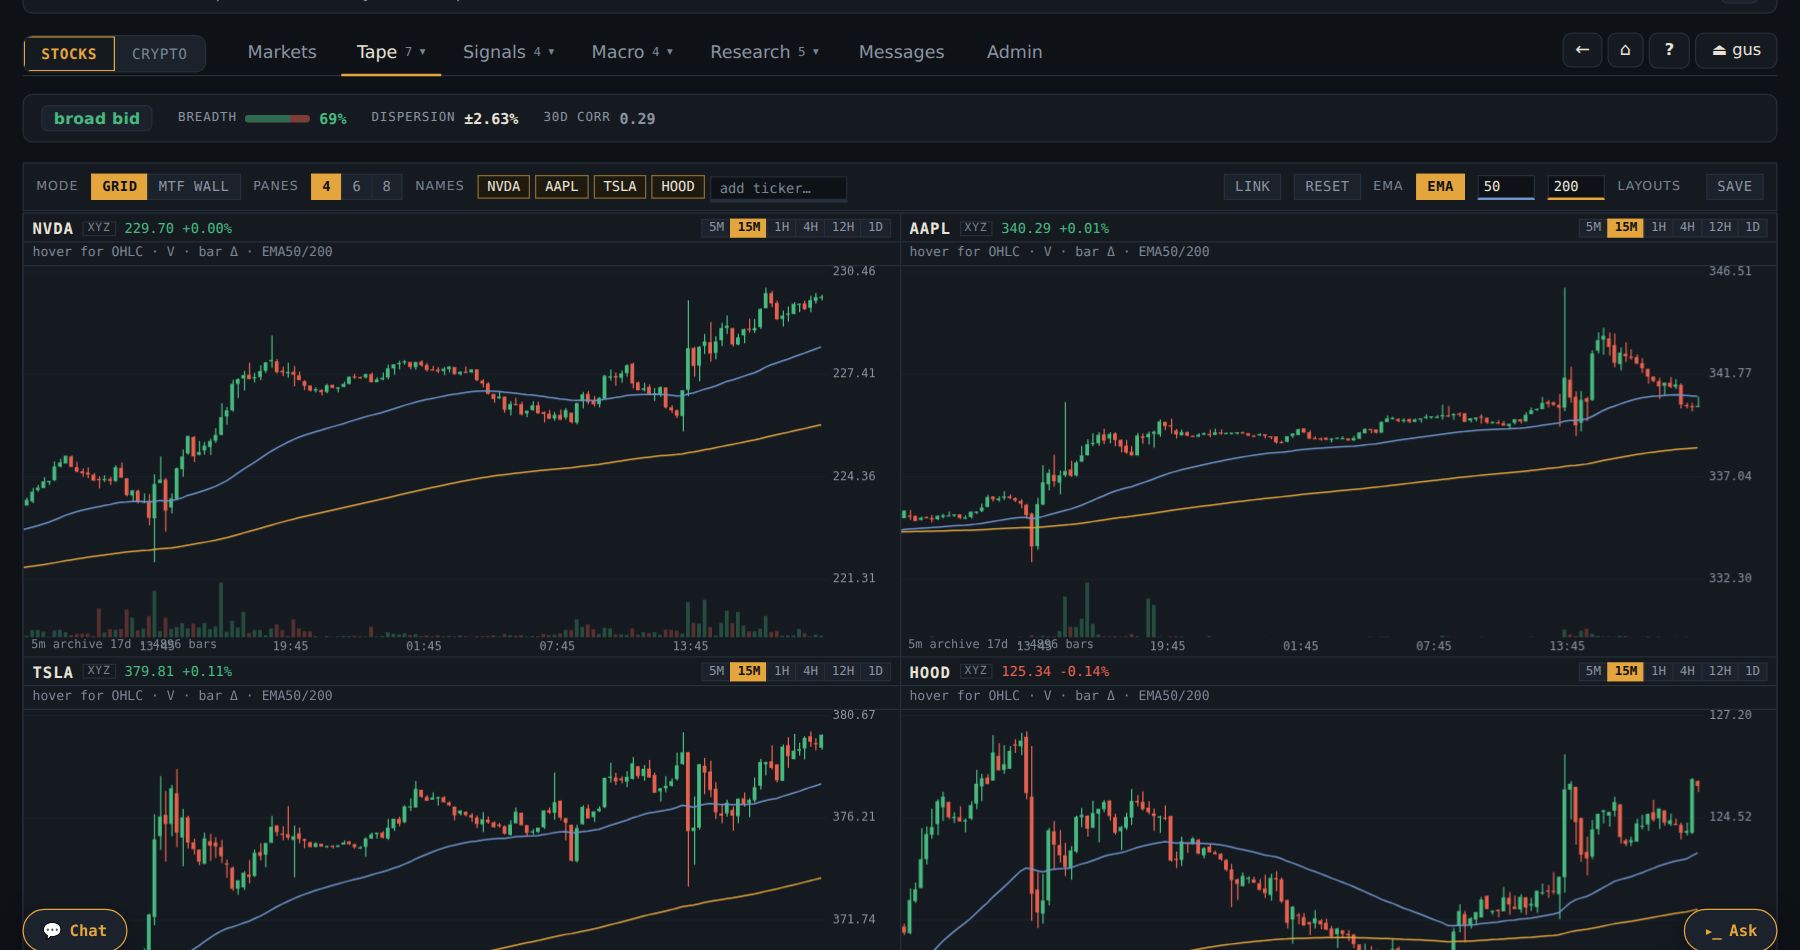
- Click GRID, pick panes (1, 2 or 4) and type a ticker in the names box for each.
- Click LINK so all panes move together.
- Click INDICATORS to add RSI, MACD, Bollinger Bands — or your own script.
- Click DRAW for trend lines, levels, boxes and Fibonacci.
- Treemap: Tape → Treemap, pick size and a window.
- GRID puts up to four names side by side; choose panes — 1, 2 or 4 — and fill each from the names box (in a 1-pane grid a new pick replaces the name shown). Each pane keeps its own timeframe: 5M · 15M · 1H · 4H · 12H · 1D · 3D.
- MTF WALL puts one name across timeframes — 2 panes (1H and 1D) or 4 (15M, 1H, 4H, 1D) — so you see the same day at every scale.
- LINK shares the crosshair and zoom across panes (always on in the wall), so hovering one bar lines up the same moment everywhere. RESET returns every pane to its default window.
- Read the legend. Top-left of each pane: the bar's open, high, low, close, volume and change, then every line drawn with its value (▲/▼ when a line sits off the visible range). The header has the mark and its 24h change.
- Scale with the axes. Drag the price axis up or down to stretch or squash prices, drag the time axis to zoom time; the wheel works over either. A, bottom-right of each pane, puts the price axis back on auto. Click a pane and the keys work: ←/→ pan, +/− zoom, A auto-scale, Home reset.
- SAVE keeps the arrangement — mode, pane count, names — as a named chart layout (up to 12); click one under layouts to bring it back.
- INDICATORS opens the dialog. Built in: the EMA pair (50 and 200 to start, both periods yours), the month and year VWAPs (anchored on the 1st and on 1 January, UTC) and volume. The library adds SMA, EMA and WMA, Bollinger Bands, Keltner and Donchian channels, Supertrend, RSI, MACD, Stochastic, CCI, Williams %R, ADX/DMI, ATR, OBV and MFI.
- Oscillators get their own pane under the price (up to four). Drag the rule above one to make it taller or shorter; double-click the rule for its default height. Its value axis scales like the price axis.
- Set one up by clicking its name in a pane's legend (or its ⚙ in the dialog): its inputs, and each line's colour, thickness and style — solid, dashed, dotted — or hide one line.
- Indicator sets, at the top of the dialog: Save indicator set… names everything on now (inputs, colours, pane heights); Load puts it on every chart, whatever names are open; Delete removes one. Both have Undo. Up to 12.
- DRAW opens the tools beside the charts: trend line, ray, horizontal line, rectangle, Fibonacci retracement, measure and notes.
- Drag, or click two points (on a phone, tap twice). The magnet snaps a point to the nearest open, high, low or close.
- Click any drawing to change its colour, thickness and style, or press Delete.
- In the Indicators dialog open My scripts and start a new one — or start from one of the ten examples (Keltner channel, RSI with signals, volume spikes, an EMA cross, an MA-cross strategy, pivots drawn with lines and labels, session ranges, MACD…).
- Paste a TradingView script as it is. Pine v5 and v6 run bar by bar, oldest first, the way
TradingView runs them:
if, loops,var, your own functions and types, arrays, maps and matrices, theta.*library, colours that change bar by bar, lines, labels, boxes and tables, andrequest.securityfor another timeframe or another name on this site. - The editor previews as you type: pause and every pane redraws with the unsaved script, any error marked on its line. Ctrl/⌘+Enter runs it now. Save to my scripts keeps it and puts it on the charts, where its inputs and line styles are set like any indicator's.
- A
strategy()is backtested on the pane's bars: entries and exits are marked on the chart, the result sits in the legend, and the editor lists net profit, win rate, profit factor, drawdown, buy-and-hold and every trade. - Share it. The share button beside one of your scripts makes it public — every member finds it in the indicator search under Community, with your handle — or private, for the members you name by handle (they find it under My scripts › Shared with you). Your later saves reach their charts; Unpublish takes it back off them.
- Use somebody else's: add it from Community or Shared with you like any indicator. Copy to my scripts, in its settings, opens its source as a script of your own to change.
- Errors say what and where. The kind (syntax error, unknown name, wrong type, not supported,
stopped), the line, and a hint where one helps — "did you mean
close?". A script that runs but is probably wrong — a line with no values, a length longer than the chart — gets a warning instead. - What will not run: Pine libraries (
import) and other chart types (Heikin Ashi, Renko, Kagi…); alerts in a script are skipped with a note. Data this site does not have — financials, earnings, dividends, economic series — reads asnawith a warning, so the rest of the script still draws. - Scripts are sandboxed. A script — yours or a member's — runs in a worker with no network and no access to the page or your account, and is stopped after 2 seconds. Up to 16 scripts of 12,000 characters each.
- Pine Script is a trademark of TradingView. The subset here is this site's own and not affiliated with it; script times read UTC.
- Two archives, never blended. 5M, 15M and 1H read the local 5-minute archive; 4H and up read the deep daily archive back to each listing's birth. Each pane says which. 3D folds the daily bars into three-day buckets, TS9's own 3D grid.
- A lighter bar inside an outline is live and unconfirmed. The short panes refresh their right edge every 20 seconds while the tab is open; the exchange's own record of a bar replaces the live one within minutes. Signals, alerts and the record only ever read the confirmed archive.
- TS9 (where the BOW and Pulse tabs are open to you) puts TS9's signals on the 4H to 3D panes: bearish ones above the bar, bullish ones below, with their score. The button turns them off.
- It all follows you. Drawings belong to the name — one drawn on 4H sits in the same place on 1H and 1D, in every pane showing that name. Indicators, their settings, layouts and scripts are kept per browser and, signed in, synced to your account.
- Warm-up bars for an EMA, or any indicator, stay empty rather than plotting an unconverged line.
- On a phone, press and hold for the crosshair; the controls fold behind ⚙.
- Choose size — 24h volume or open interest. Volume shows where the activity is; OI shows where the positioning is.
- Choose the window — colour is the move over it.
- Click a tile to open the name.
- Size by OI and window 7d is the fastest way to see where a week of red actually hurt.
 1234
- 1GRID or MTF WALL
- 2panes
- 3add ticker…
- 4LINK
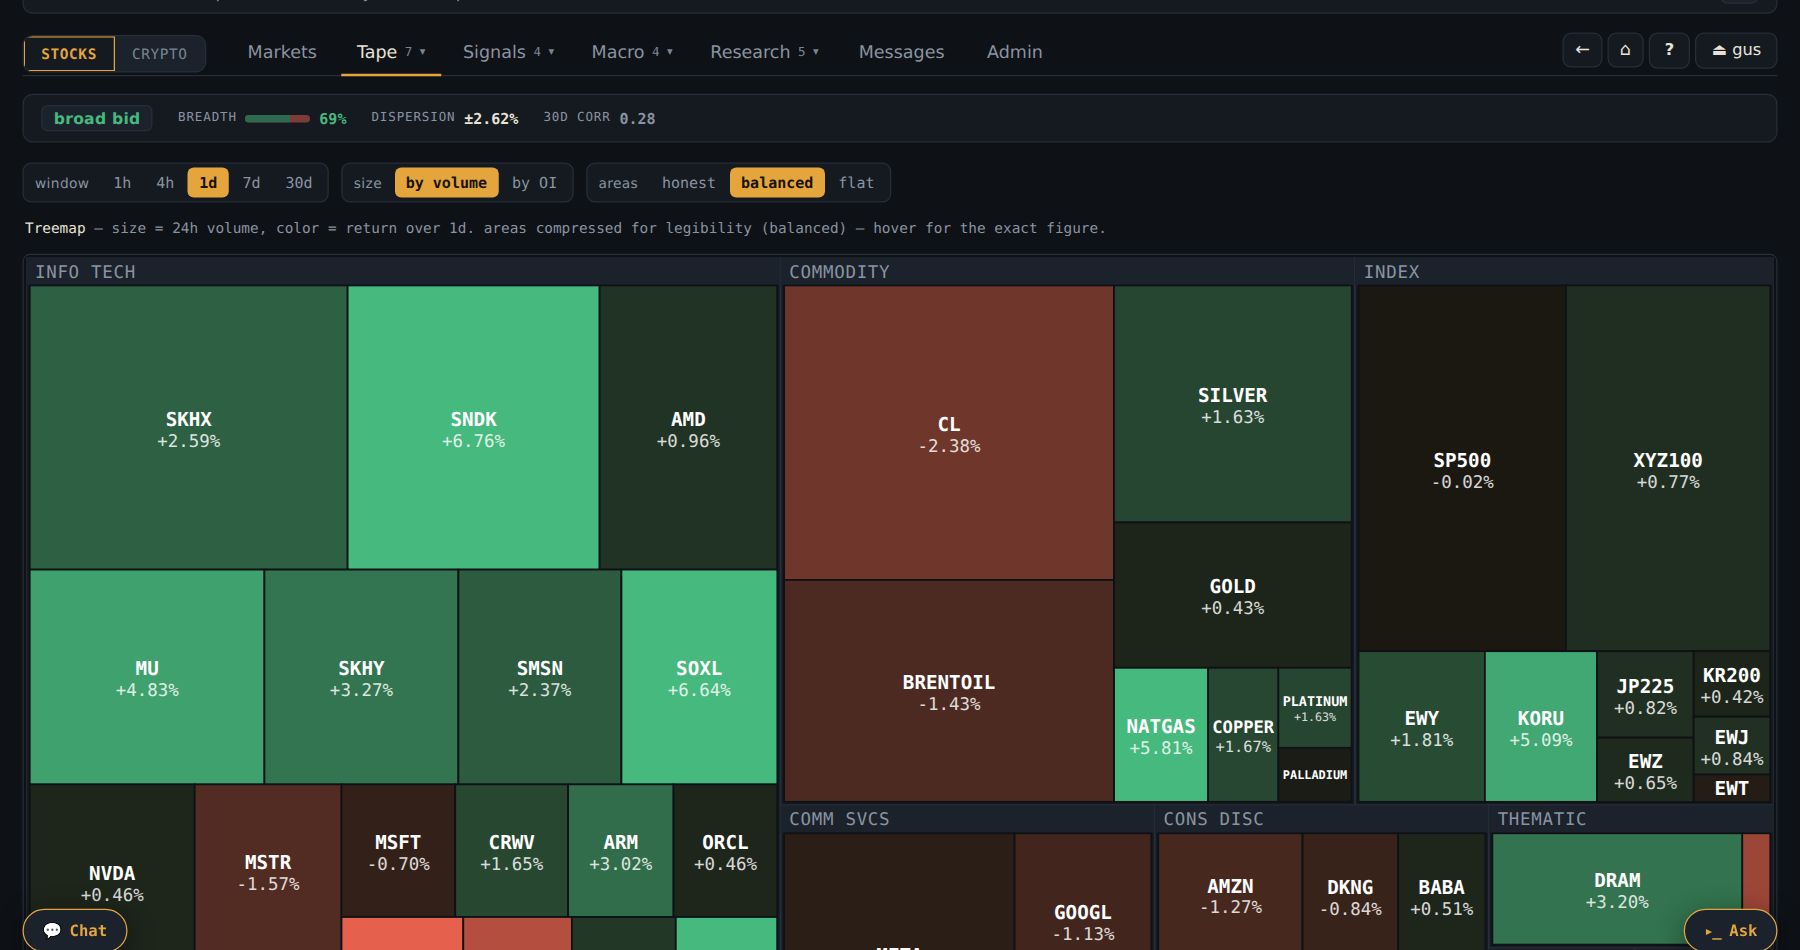
MU drops 3% in an hour. Before deciding it is a Micron story you open Charts, GRID, four panes: MU, NVDA, AMD, AVGO, 1h, LINK on.
Hovering the red bar on MU lines up the same hour on all four: they all dropped together. That is a semis move, not a Micron move — and the treemap sized by OI, window 1d, shows the whole tile block red.
So: you do not go looking for Micron news that is not there; you look at what hit the sector.
You have read a TradingView squeeze indicator for two years and do not want to learn a new one. In INDICATORS › My scripts you paste its Pine source. The panes redraw as you stop typing, with one warning under the editor: alertcondition() and alert() are skipped. Everything else draws.
You Save to my scripts, set its colours from the legend, and Save indicator set… it with your EMA pair as squeeze. A colleague asks for it, so you share it privately with their handle; it appears in their Shared with you.
So: your own tool now runs on every name and timeframe here, next to the board's numbers — and when you fix a bug in it, the copy on your colleague's chart is fixed too.
06Sectors
Tells you which theme is being bought or sold — and whether the theme trades as one block or as a bucket of stock picks.
- Open Tape → Sectors.
- Look at the top-right corner: that is where money is going in.
- Look at the top-left: that is where money is leaving.
- Click a bubble to see the names inside it.
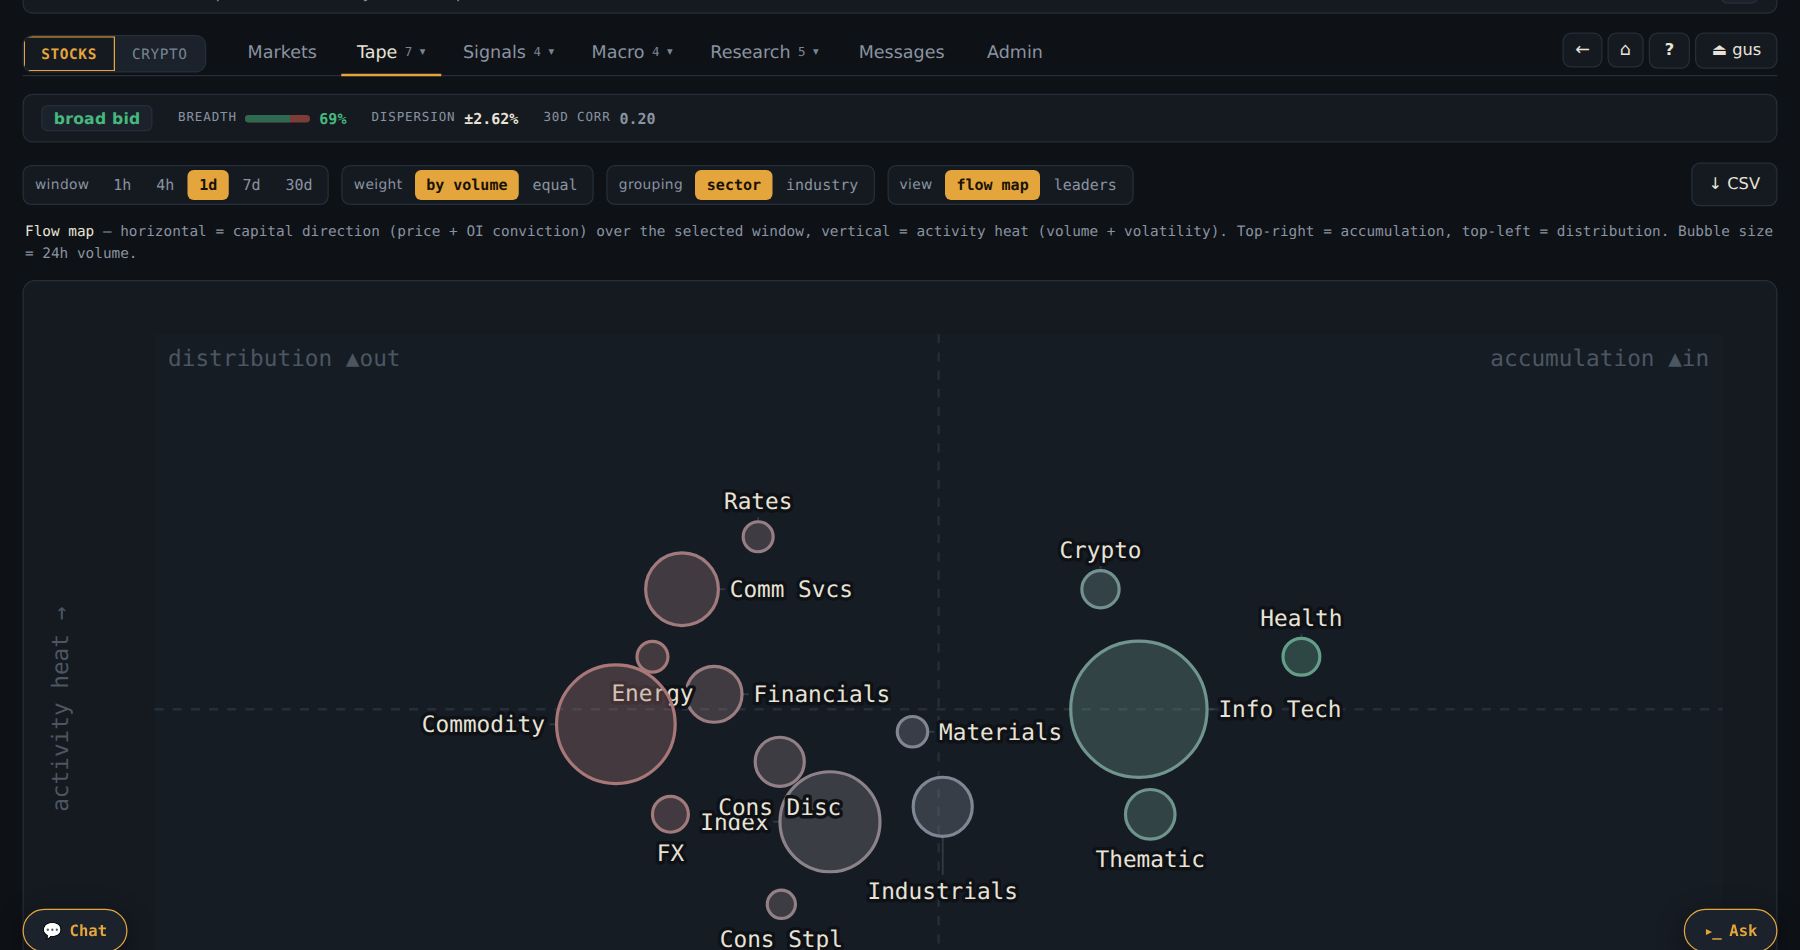
- Start on the flow map. Each bubble is a sector. Right = money flowing in with conviction (price plus open interest); up = activity (volume plus volatility); size = 24h volume. Top-right is accumulation, top-left is distribution, the bottom half is quiet.
- Flip to Leaders to see who is beating the benchmark (right) and whether the lead is growing (up) or fading. "Catching up" is where early rotation shows; "Cooling" is where leadership goes to die.
- Read Cohesion on the rotation board. High = the label trades as one thing, so any member will do; low = a stock-picker's sector where the name matters more than the theme.
- Click a bubble for its members with their own contribution to the composite.
- Try equal-weight. By volume, a mega-cap can be the whole sector's story; equal-weight shows whether the rest agree.
 123
- 1flow map / leaders
- 2window
- 3weighting
- The sector × sector correlation matrix catches one risk factor wearing two names — Semis and Software moving together is one bet, not two.
- Grouping switches from GICS sectors to curated industries (Semis vs Software vs Memory). Industries are display-only; the signal engine keeps pooling on the eleven sectors.
The map shows Semis in the accumulation corner and Software in distribution. On the rotation board, Semis has Cohesion 0.78; Software has 0.31.
High cohesion means the semis are moving as one block — any liquid semi gets you the theme. Low cohesion in software means the label is meaningless; some names are being bought and some dumped under the same word.
So: for semis you pick by liquidity and take the theme. For software you click the bubble, look at the members' contributions, and pick the one actually in the flow. Same tab, two different ways to act.
07Correlation
Stops you from owning the same trade three times under three tickers — and shows you the natural hedge when you want one.
- Open Tape → Correlation.
- Find your two names in the matrix. Hover the cell: the number and the days behind it.
- Click the cell for the pair view.
- Read the z-score: past ±1.5, one name is rich or cheap against the other.
- Matrix. Names are cluster-ordered, so the blocks along the diagonal are real co-movement families. Hover a cell for the correlation and the number of days behind it — a ±0.9 on twelve days is noise. Use the focus search to isolate a few names; widen or narrow with top by vol.
- Click a cell for the pair view: the hedge ratio (β, units of B per unit of A), the spread between them with its mean and ±1σ band, and the z-score. Beyond ±1.5–2 one side is rich or cheap against the other. The rolling correlation underneath says whether the relationship is stable enough to trust.
- Click a ticker label for its co-movers (proxies and contagion) on one side and its natural hedges on the other.
- COMP/G overlays several names rebased to 100 at an anchor you choose — presets, a date, or drag the amber line. Spread mode shows each name minus the basket of the visible names.
- Ratio draws synthetic pair candles (A divided by B) with a properly honest EMA200 — drawn only where 200 bars exist. BTC may face a stock here, aligned on the hours both traded.
- Type
comp AAPL MSFT NVDAorratio NVDA/BTC 4hinto the Ask console to jump straight to these views.
You are long NVDA and like AMD too. In the matrix, the NVDA–AMD cell reads ρ 0.85 on 90 days. Click it: the spread sits at +1.8σ — AMD is rich against NVDA.
Adding AMD would be the same bet twice, and at a bad relative price. The hedges panel for NVDA shows the name that has moved against it most consistently.
So: either you skip AMD, or you turn it into a pair (short the rich one, long the cheap one) — or you keep NVDA and cut some beta with the hedge. What you do not do is buy AMD thinking it is a new idea.
08Funding heatmap
Carry is a cost or an income on every perp you hold. This screen shows who is paying, across the whole book, over days — so you can see crowding building or fading rather than a single number.
- Open Tape → Funding.
- Red = longs pay. Green = longs get paid.
- Click 8h.
- Compare the last two columns: now vs mean. Now higher = crowding building.
- Read the colours. Red = longs pay (the crowd is long; holding costs money). Green = longs receive. Every row is also labelled with its signed number, so you never depend on colour alone.
- Pick a resolution — 1h, 8h or 24h. In the default annualized unit, the timeframe is only a zoom: one market reads one number on every grid.
- Compare now against the mean. Each row ends with its window mean and its current funding in the same unit. Current above mean = carry building; below = fading.
- Sort by carry side, by |carry|, on the mean or on the now column.
- Switch to per-bucket only when you want the actual amount a 1× long paid over a bucket — that unit changes with the timeframe (about 8× larger per 8h than per 1h).
- Hatched cells are honest gaps — the data covered under half the bucket's hours. They are never drawn as "flat", because a gap and a genuinely flat market mean opposite things to anyone sizing a position.
- The newest column is always the last complete bucket.
- Rows rank by open interest; show top 25, 50 or everything.
You are long HOOD and it is Thursday. Its row on the 8h grid has been red all week; the window mean is +58% and the now column is +71%. The crowd is paying more every day to be long.
71% annualized is roughly 0.2% of notional per day. On a name you expect to move 2–3% a week, that is a real slice of the expected return going out the door.
So: you either accept the cost knowingly, size down, or wait for the now column to fall back under the mean before adding. The point is you saw the bill before it arrived.
09Sessions
Answers when the returns actually happen — overnight, over the weekend, or during the cash session — net of the funding it costs to be there.
- Open Tape → Sessions.
- Look at the three lines: overnight, cash, weekend.
- The one that rises is when the money was made.
- The red band underneath is what funding cost. Only the part above it is real.
- Start with the decomposition. Three equity curves: what an overnight hold (close→open), a weekend hold and a cash-session hold each paid, pooled across the equity universe.
- Watch the shaded band. That is the running funding drag. An edge that dies inside the band is a donation.
- Read the clocks — hour-of-day activity in each market's own norm, the funding clock, the day-of-week heatmap — with sample-size humility; hover for the breadth behind every point.
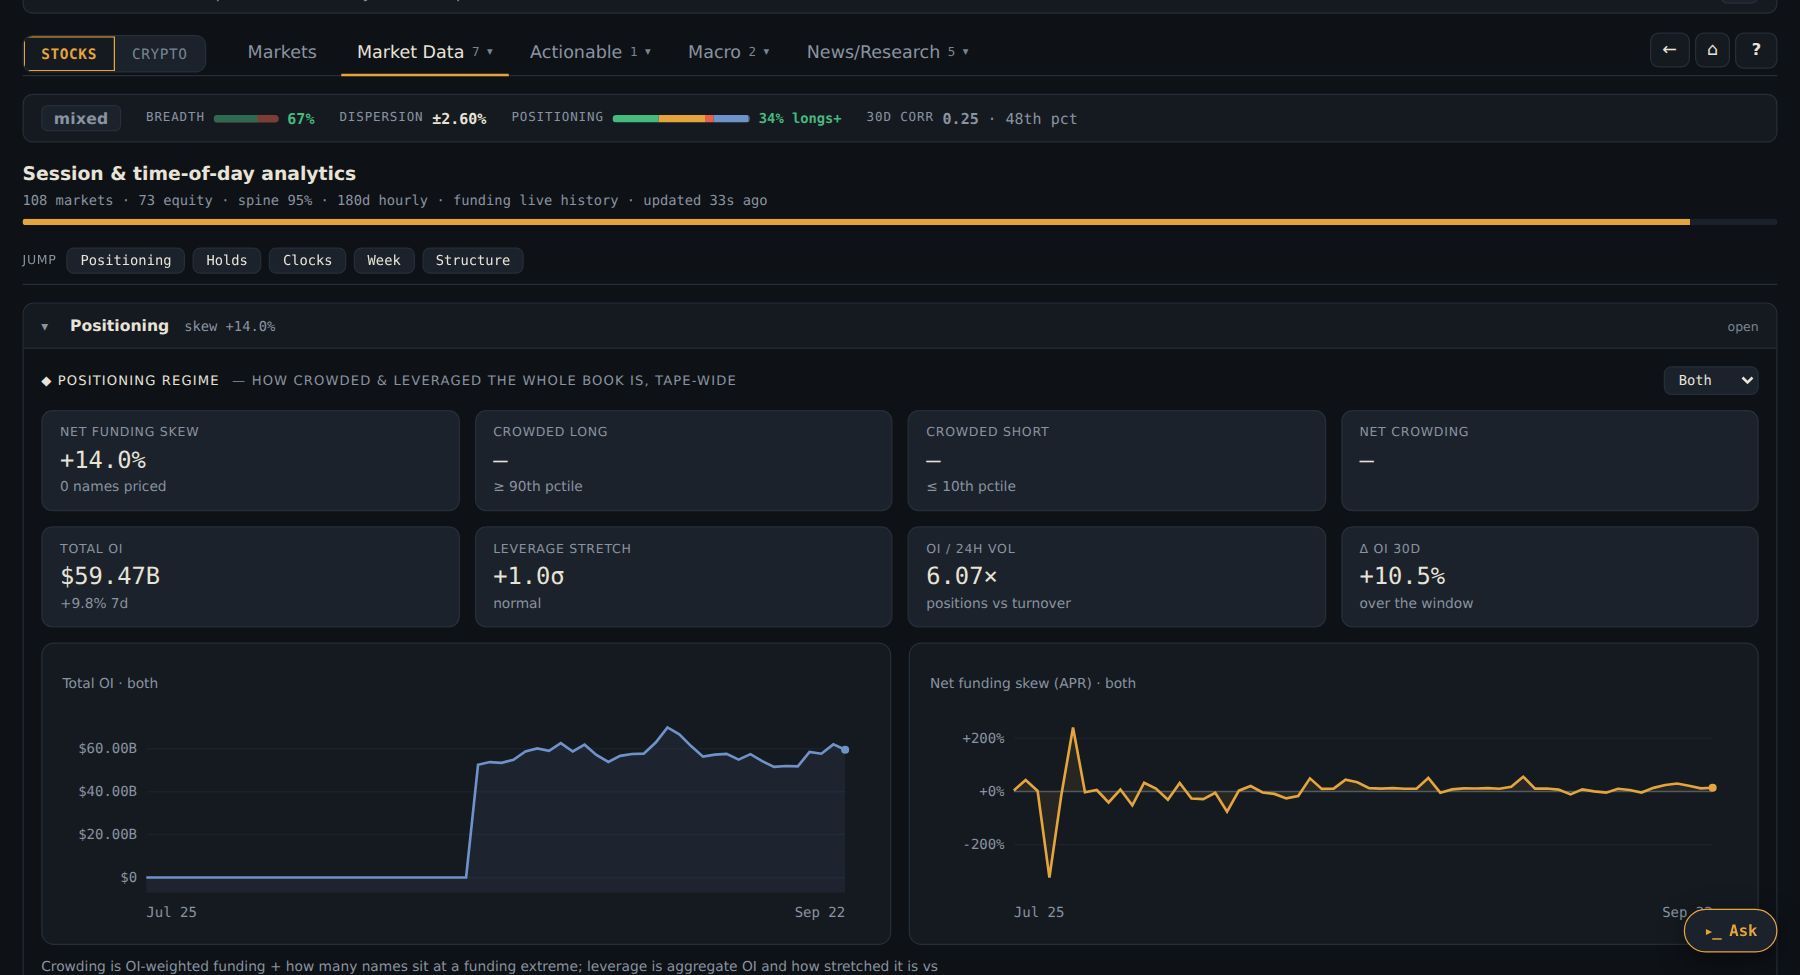
- A rising overnight curve against a flat cash curve is the classic overnight effect. The drawer's where the 30d return happened panel is the same question asked of one name.
- Panels that need more history than exists yet stay empty rather than showing thin data.
- None of this exists in crypto scope — a 24/7 tape has no sessions.
You have been flattening at 4pm ET on principle — no overnight risk. The decomposition says overnight holds returned about +6% over the period, net of the funding band, while the cash session was flat.
So: your caution has been selling the part of the day that paid and keeping the part that did not. You do not have to change everything — but the drawer's 30d split on your own names is now the first thing you check before deciding when to hold.
10Gapsoperator-only by default
Before the US open, the perp is the only live price for an xyz stock — so it is already pricing tomorrow's opening gap. This tab tells you that gap, and how much of a gap like it has usually still been there at 10:00 ET.
- Open Tape → Gaps any time the US cash market is shut.
- Sort by Implied: the biggest gaps the perp is pricing.
- Read Capture beside each: how much of it has usually held.
- Read Expected by 10:00 and its band.
- After the open, come back: the board shows how the morning went.
| name | implied | capture | held | expected by 10:00 | nights |
|---|---|---|---|---|---|
| HOOD | +4.2% | 0.82 0.61…1.03 | 71% | +3.4% ±2.1 | 174 |
| TSLA | −2.6% | 0.55 0.30…0.80 | 58% | −1.4% ±2.4 | 178 |
| COIN | +1.9% | — | — | — | 14 |
- Implied is the perp's distance from its own price at the last cash close: the gap the market is pricing now.
- Capture is how much of the implied gap has usually survived to 10:00 ET, from the name's own last 180 nights: 1.00 means the pre-open perp has been an honest read, 0.60 that about 40% has usually faded. The small range beside it is its 90% interval — a wide one means the history is not telling you much yet.
- Held is how often the 10:00 print kept the implied direction.
- Expected by 10:00 is capture × implied, with a band. A base rate, not a forecast.
- During the session the board shows how this morning went: implied at 09:00, where the name stood at 10:00, and now — held, extended or reversed.
- The night with news is the night the history describes least. An earnings print or a headline overnight is exactly when capture is least reliable — check Calendar and News first.
- Names whose stock trades in Seoul, Tokyo, Hong Kong or Shanghai have their own table, measured on their home exchange's clock.
- Both ends are the perp's own prices; the stock's opening auction is not in this data.
At 08:40 ET HOOD's perp is up 4.2% on a downgrade of a competitor. You want in before the open.
Gaps says capture 0.82 with an interval of 0.61…1.03, held 71% over 174 nights: on HOOD, most of a pre-open gap has usually still been there at 10:00. TSLA, also gapping, shows 0.55 — half of its pre-market moves have tended to fade.
So: you size the HOOD idea as a gap that tends to hold, and you leave the TSLA gap alone rather than paying the pre-market for a move that has usually given half of itself back.
11Cross-dexoperator-only by default
Some stocks trade as perps on several HIP-3 dexes at once — two books, two crowds, two funding rates. This board puts them side by side, so you can see a price or carry difference, and what it would cost to take it.
- Open Tape → Cross-dex.
- Sort by |mark Δ| for price differences, or by carry for funding ones.
- Read the net over a one-day hold and b/e before anything else.
- Open the name's drawer: On other dexes reads both order books.
- Each row is an xyz market and the same underlying on another dex. Mark Δ and Oracle Δ are the other leg against xyz, in basis points (+ = the other trades richer).
- Funding is each dex's current rate, annualised (+ = longs pay); Δ is the difference. Each deployer sets its own funding settings, so a difference can be structural rather than a crowd.
- Carry is the pair trade: long the leg that pays less funding, short the other. It shows the funding earned per day per $10,000, the fees for a round trip on both legs, the net over a one-day hold, and b/e — how many days of carry the fees cost.
- In the drawer, On other dexes reads both order books when it opens: spread, depth within ±1%, and the average fill for $10k and $50k.
- The fee is an assumption, stated on the board: 4.5bp a fill. A market in growth mode charges far less (the row says so); a deployer's fee share can charge more.
- Refused pairs under the table are matches whose prices sit more than 10% apart — a different contract (another unit, say), not a spread.
- Funding is this hour's rate and can change at the next; a mark spread can widen as easily as it closes. A leg older than 10 minutes is marked stale.
12Signals
A ranked list of unusual conditions with their measured history attached — and a public record of how every past flag turned out, so you can decide how much to trust the next one.
- Open Signals.
- On each card, read line 2 first. Find n.
- n under 8 = a story. n over 20 = a base rate.
- Look for ★ prime.
- Type a ticker in the search box to see everything the engine ever said about it.
- Line 1 — the event, a plain-language reading, when it appeared, and the claim it is scored against (the frozen mark and the time to resolution).
- Line 2 — the evidence, always in the same order: scope · n · median outcome · hit rate · expectancy · horizon. n is the number that matters. A pill saying unproven means no history; neg exp means past occurrences lost money on average.
- Line 3 — the mechanical play: side, target, the level that voids it, reward:risk. These are frozen when the claim opens and never move.
- Line 4 — the one corroborating thing to watch.
- 1What and when — the event, the reading, and the mark the claim is scored against.
- 2The evidence — read n first. 23 occurrences is a base rate; 3 is a story.
- 3The mechanical play — side, target, the level that voids it. Never moves after it fires.
- 4One thing to watch — the corroboration that would confirm or kill it.
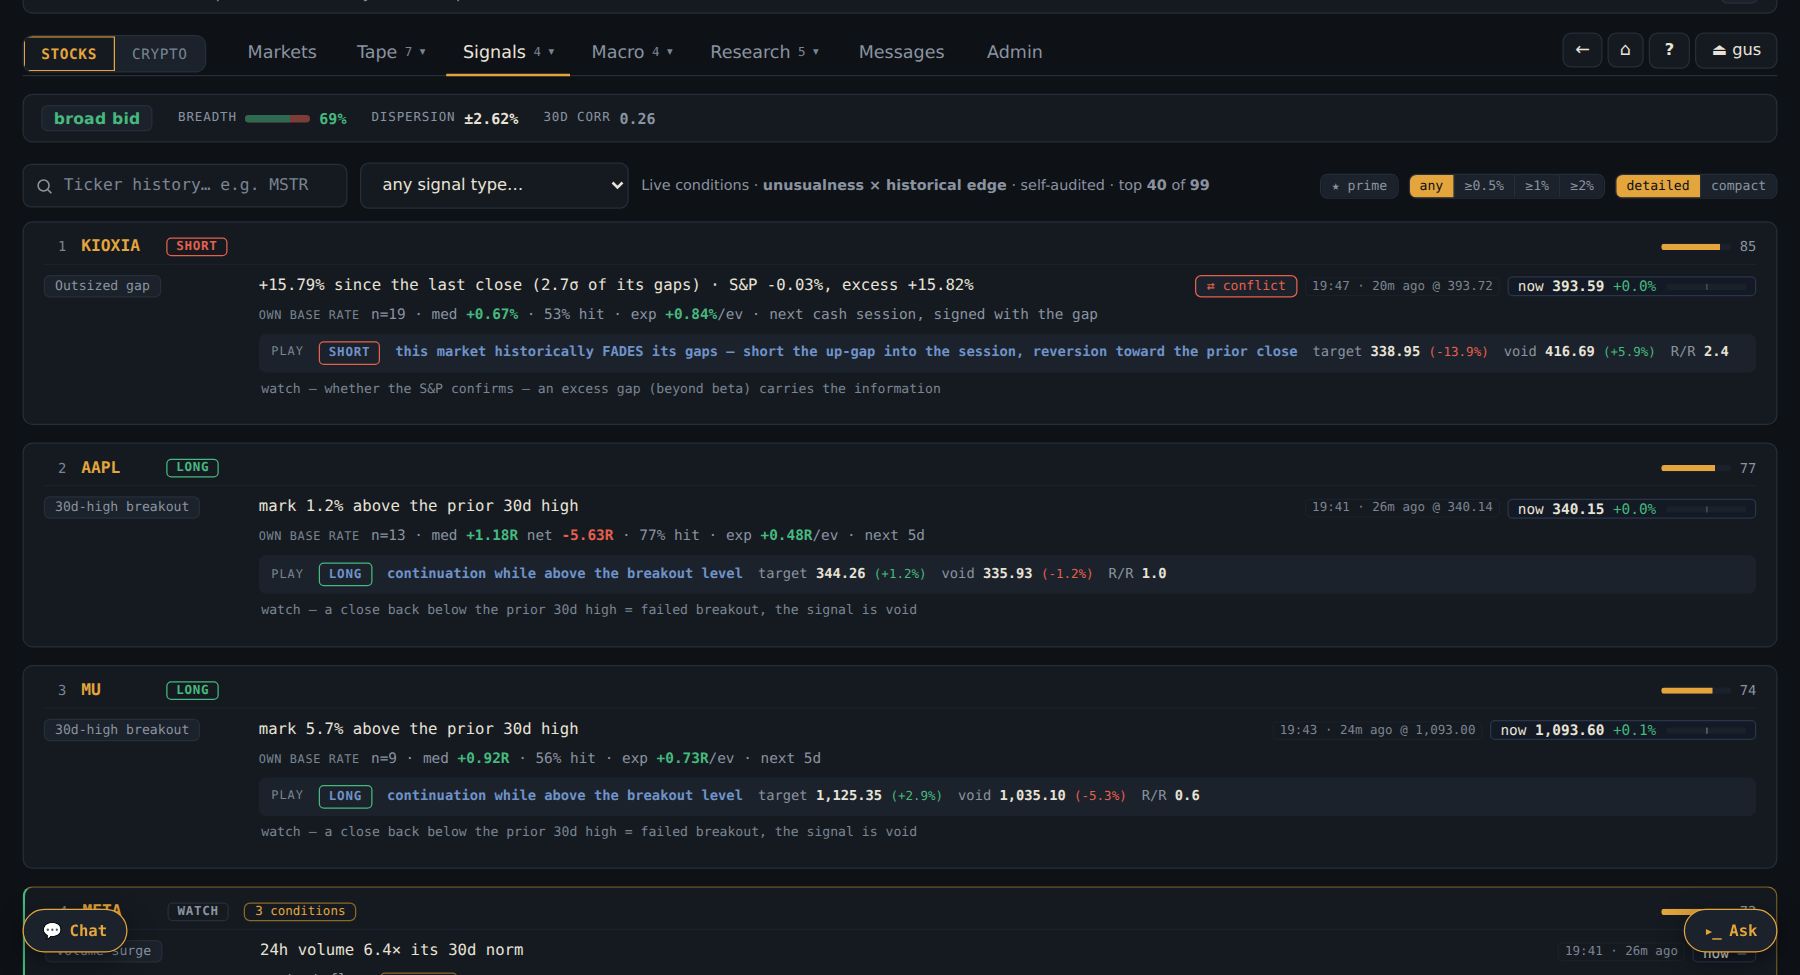
- Sort by score, but read n first. Score is unusualness now plus historical edge; a high score on n=3 is a story, not a base rate.
- Prefer ★ prime — ≥60% hit, positive expectancy and sound structure at fire time.
- Mind the decay. A signal past its claimed horizon dims (amber) and drops at twice the horizon. A stale signal is not a signal.
- Check the earnings guard. A card flagged for a print inside the horizon has its evidence capped, on purpose, and says so.
- Search a ticker to see its complete claim-by-claim history — what fired, at what mark, what it claimed, what happened. Do this before you trust any card on that name.
- Look at the accuracy panel occasionally: live hit vs claimed, the profit factor (which catches the 55%-hit signal that still loses money), and the calibration buckets that audit the ranking itself.
- ⇄ on a card means long and short fired on the same name — flagged, and nobody gets a confluence bonus.
- Confluence (several same-side conditions on one name) only earns a bonus once the record proves agreement helps. It is measured, not assumed.
- The Actionable taboperator-only by default is the subset of these claims that are at their trigger right now, with reward:risk net of funding.
- The Backtest taboperator-only by default tests a ranking rule on the whole universe — or, with a name in its target box (or ★ watchlist), asks the smaller question "does this signal work on NVDA?". Under 10 round trips it tells you the Sharpe is an anecdote. Its D1 retest study replays the Trend board's RETEST over every closed day and reports the edge over simply being in the trend.
Card A: FUNDING EXTREME · HOOD · short, n 23, hit 65%, +0.9R, ★ prime, void 117.2. You search HOOD's history: 18 past claims, 61% hit. That is a base rate.
Card B, higher score: BREAKOUT · a thin FX pair · long, n 3, unproven. The score is high because the condition is very unusual, not because it has ever paid.
So: A gets sized to its void (117.2, about 3% away) and B gets ignored — or watched, to see whether it earns a record. The score ordered them; n decided.
13EMA Touchoperator-only by default
The two lines most traders already watch — the 50 and 200 EMA on the 4H and 1D candles — watched for you across the whole roster: who is touching one right now, who is about to, and what happened last time a candle closed on it.
- Open Signals → EMA Touch.
- Read the Touching now group at the top of Touches (the left pane).
- On a card, read the big number (how long ago) and the action line under the title.
- Glance at Near a line on the right: those are the next touches.
- Click a ticker to open its drawer and check the candles.
- Read the groups top to bottom. Touching now is a candle still forming on a line (soonest close first) — it has not resolved. Fresh resolved within the last 3 bars (4H) or 2 sessions (1D): that is the actionable window. Fading is dimmed context, not a setup.
- Read the title as the verdict. Testing support / Testing resistance while the candle forms; at its close it becomes Support held, Resistance held, Broke down or Reclaimed.
- Use the action line as your stop. Every card names the level and the close that invalidates it — "Bullish while above 148.05. A 4H close below it invalidates."
- Watch the outcome. ✓ worked means price has gone at least 1σ the expected way; ✕ failed means a later close went back through the line, and the card fades at once.
- Look ahead with Near a line. Every line within 1.5σ of the mark, nearest first, with the % beside it. stacked means the 50 and the 200 sit within half a sigma of each other — one touch tests both.
- Narrow it. The controls row: TF (both · 4H · 1D), EMA (both · 50 · 200), View (by stage · newest first) and Show (all · live + fresh).
- Distances are in σ, not %. σ is the rung's own bar-return spread, so 0.5σ is equally close on BTC and on gold. The % is beside it for when you want it.
- NEW marks touches since your last visit (kept per browser; the first visit marks nothing).
- One card per episode. After a card the line has to re-arm — a close at least 1σ clear — before it can open another; touches before that fold into the same card as retouches.
- 1D is the US session on a stock or index: weekend perp prints fold into Monday's candle, so the tab, the chart and the alert agree on what a daily candle is.
- The bell has matching alert classes — ma200, ma50 (close-confirmed) and touch200 / touch50 (intrabar, opt-in) — operator-only while the tab soaks.
NVDA has run for three weeks and you did not want to chase. At 11:40 the EMA Touch feed shows NVDA · Testing support on the 4H 50. You wait for the close.
At 12:00 it reads Support held: "Bullish while above 148.05. A 4H close below it invalidates." You open the drawer, the trend board still reads 4/4 long, and funding is ordinary.
So: the entry you wanted arrived with its stop already written. Two bars later the card says ✓ worked; had a close come back under 148.05, it would have said ✕ failed — and so would your plan.
14BOW and Pulseoperator-only by default
TS9's two scoring engines — BOW (stretch and snap-back) and Pulse (price against flow) — read as legs: each call opens, joins or flips a running position per market and timeframe, so you see what is in force now and how far it has gone, instead of a list of separate pings.
- Open Signals → BOW (or Pulse).
- Read Strongest setups at the top: the open legs on 12h, 1D and 3D.
- Click a leg for its card: reference price, now, every signal.
- Press Open chart to see the calls on the candles.
- Want more? Toggle Score ≥ 75 (Pulse: ≥ 60) in the bar.
- Know the four signals. BOW: RECOIL ▲ (bullish, out of the coiled zone) and SNAP ▼ (bearish, out of the extended zone), scored up to 100; ◆ marks 90 or more, the flame 75 or more. Pulse: ABSORB ▲ (price makes a lower low while flow makes a higher one) and DIST ▼ (the mirror), scored 60, 80 or 100.
- Read them as legs. The first call on a market and timeframe opens a leg; repeats the same way join it (×N); the opposite call closes it and opens the next. There is no stop and no age limit — a leg ends only on an opposite call.
- Check freshness. Bars since the latest signal: FRESH (filled dot) up to 3, RECENT to 10, MATURE (hollow) beyond. It tells you how old a leg is; it never hides one.
- Open the card, then the chart. The card has the reference price, now, the latest signal, every signal and the previous leg. Open chart draws the market's candles on 4H, 12H, 1D and 3D with every BOW and Pulse call — bearish above the bar, bullish below — and the open leg's span.
- Use the bar, then Filters. Timeframe, direction, the score toggle and ◌ Partial are in the bar; freshness and other minimums are under Filters. When filters hide legs, one line says how many and why — each reason is a button that lifts just that filter; Show all lifts them all.
- Below the top list: the BOW matrix (every market × timeframe), Pulse's timelines (one row per market over the last 120 bars, the open leg running bright to now), the 4h legs in their own section, and closed legs with their move, length and the call that ended them.
- Timed from availability. Every call counts from when it became available — the bar after the one it reads. A Pulse divergence is anchored to an earlier pivot, but its leg opens when the confirmed call arrived, at the confirmation bar's close. No move is measured from a price you could not have had.
- ◌ Partial (off by default) adds legs from calls TS9 flags as having incomplete history — mostly young listings short of a year of weekly bars. They are drawn faded and never enter the record.
- There is no headline hit rate yet, on purpose: summary statistics come back once the history is long enough to mean something.
- An empty page says why. Data status, folded away, has the technical detail: what the server's history holds, what the last scoring run brought, what TS9 could score.
- Calls reach your phone too — see Alerts: BOW signals and Pulse signals, with your own choice of events, timeframes and minimum score.
On Monday the BOW page's top card is MSTR ▼ SNAP · 1D · 100, FRESH, −2.1% since the call. The previous leg was a ▲ RECOIL that ran +14% over 11 bars before this SNAP closed it.
You open the chart: the SNAP sits above the bar that tagged the weekly high, and Pulse has a DIST on the 12h two bars earlier. Two engines, one direction.
So: you treat the up-leg as over and the short-side read as in force — and because a leg only ends on an opposite call, you know exactly what would tell you it is wrong: a RECOIL on the same timeframe.
15Calendar
The two things that reliably blow up a well-reasoned position: an earnings print and a macro release. This is where you see them coming, and how this name has behaved through prints before.
- Open Macro → Calendar.
- Find your names in Upcoming. Note the day and BMO (morning) or AMC (after close).
- Read the reaction study: the usual move on a print.
- Open the Setups strip at the top: one card per name reporting in the next 5 sessions.
- Size smaller than usual into it — by that multiple.
- Upcoming — the next two weeks of earnings for the universe, grouped by day with the session: BMO before the open, AMC after the close. Starred names float to the top of each day.
- Reported — the last two days stay on the tab with actual vs estimate, beat/miss, and the print's own reaction candle. The tape's verdict is the move beside the EPS verdict; they often disagree.
- Reaction study — for each name: how many prints, the average and median move the next session, how often up vs down, gap behaviour, and the move as a multiple of the name's usual daily range. That last one is the sizing number.
- Macro rows — FOMC, CPI, payrolls, PPI, retail sales, GDP, PCE, with the prior print shown ahead of the release and prior → actual after.
- Setups — the collapsible strip at the top: a pre-earnings setup card for every name reporting within the next 5 US sessions. Each card puts four things side by side: the reaction study (typical move, up/down split, gap-and-hold vs gap-and-fade), positioning into the print (funding and its percentile against the name's own month, OI change over the run-up, premium), the run-up against how this name usually drifts before a print, and implied vs typical (is volatility compressed or already elevated?). A verdict line sums it up from fixed rules — crowded long into print (funding p92, OI +18% in 5 sessions); typical move ±6.1%, gaps and fades 7/10. No AI writes it.
- You do not have to open the tab to be warned: the E badge on the Markets ticker cell (solid = today, hollow = tomorrow) and the macro banner under the nav read the same calendar.
- Indices, FX, commodities and baskets never report — the coverage line says how many names are eligible so absence is not a mystery.
- The same setup card appears as Pre-earnings setup in the ticker drawer of any name that has one. A block the server cannot fill says n/a and why (no study yet, funding history too short…) rather than showing a guess.
- A setup card is a read of who is positioned, never a call: crowded long says who is exposed, not who is right.
You open Calendar. Four of your starred names report this week. PLTR is Tuesday AMC; its reaction study says median 9%, up 5 / down 7, 2.8× usual range. FOMC is Wednesday 2pm.
Your 'short PLTR' idea just became 'short PLTR after the print, or half size into it with the 9% as the risk number'. And nothing new goes on Wednesday afternoon.
So: the week's plan takes five minutes, and the E badges on Markets will keep reminding you as each day arrives.
16News
Answers "why is this moving" without leaving the site — headlines tied to names in the universe, the macro tape and SEC filings on one feed.
- Open Macro → News.
- Press / and type the ticker.
- Red badge = an open signal on that name. FL = an SEC filing.
- Filter by ticker with /. The drawer's news panel is the same feed, already filtered to the open name.
- Read the badges. Amber = earnings within a week; red = an open signal on that name; FL = an SEC filing, with material forms marked.
- The window is 72 hours. Older is history, not news.
- Type
news nvdain the Ask console for the same slice as a table. - Material filings can also reach you as an alert class — turn it on in the bell.
TSLA is −4% at 10:10 ET with nothing obvious on the tape. You press /, type TSLA in the news filter: an FL-badged 8-K landed twenty minutes ago.
So: you have the reason in ten seconds without opening another site — and if you had the filing alert class on, you would have known before the price told you.
17Shortsoperator-only by default
Who is short the stock behind the perp, and whether that is changing — short interest, an estimated short float, days to cover and today's short-sale volume, for every US-listed name on the roster, from public FINRA and SEC files.
- Open Research → Shorts. It opens sorted by short float.
- Read the tiles: names at 20%+ short float, short interest up 20%+, volume σ +2 or more.
- Sort by Δ short interest to see where shorts are building.
- Sort by volume σ for today's unusual short selling.
- Click a name: the drawer's Short interest & volume card shows the workings.
- Short interest is the shares sold short and not yet bought back, on FINRA's mid-month and month-end dates. Δ is the change since the previous date; days to cover is short interest ÷ average daily volume — how long shorts would take to buy back.
- Short float (≈) is short interest ÷ the float. Red from 20%, amber from 10%. The ≈ is there because the float is estimated from the company's SEC filings (see the tips).
- Short-sale volume is the share of each session's off-exchange volume marked short. Read the σ — today against the name's own last 30 sessions — not the level: market makers sell short all day to fill buyers, so 40–60% is ordinary. Volume × is today's off-exchange volume against its average.
- Short interest is one to three weeks old when you read it — FINRA publishes about seven business days after the settlement date. It tells you where shorts were, not where they are.
- † on a short float means 15% or more of the float is shares issued since the 10-K. If those went to insiders, the true short float is higher than shown.
- ETFs and foreign filers (TSM, ASML, BABA) have short interest but no float. Commodity, FX and index codes are never matched — FINRA's CL is Colgate, not crude.
- A thin name (under 50,000 shares off-exchange) is hidden from the volume sorts unless you tick include thin names.
- The Markets table's Short float and Short vol columns read the same numbers.
Markets shows GME's perp with funding in the 95th percentile: longs are paying up. On Shorts, GME's short float is 21% and short interest rose 24% since the last date, with 3.1 days to cover.
Both sides of the trade are crowded — longs on the perp, shorts on the stock. Today's short-volume σ is +2.6: the selling is unusual even by GME's standards.
So: you do not read the funding alone as "longs are wrong". A squeeze needs shorts to cover, and the stock's shorts are still adding — you wait for the short interest to turn before you lean on it.
18Consensusoperator-only by default
What analysts are saying about our markets — and, more usefully, how unusual today's mood is for that name — beside what the tape has done. A bullish consensus on a falling price is flagged for you.
- Open Research → Consensus.
- Read the σ column: green at +0.8σ or more, red at −1.5σ or less.
- Look for ⚡ vs tape: the consensus and the last 24h disagree.
- Read the bull and bear sentences over the band.
- Type a ticker in the filter to find one name.
- σ is the 30-day consensus against its own last 90 days: how unusual the mood is for this asset, not how many analysts agree. +1σ on a name most analysts dislike means less bearish than usual. Weekly reads the same on 7 days.
- The band: Relative draws the σ on a ±3σ scale; Absolute draws the plain bullish share. The bull and bear sentences sit over their halves, the leading side larger.
- ⚡ vs tape is this site's own flag: a bullish consensus while the last 24h fell 2% or more, or a bearish one while it rose 2% or more.
- The data is CryptoQuant Consensus (credited in the tab's footer): curated analysts' posts, one vote per analyst over 30 days, read hourly here and kept as history.
- A sentence marked · is individual views stitched in because no clear consensus formed, or yesterday's carried over.
- Assets are matched by name, never by symbol — SP500 reads SPY (noted on the row); a name they do not cover shows a dash.
- The Markets Consensus σ column and the drawer's Analyst consensus card (with the σ over time) read the same numbers.
19AI Report
The whole board on one name, written out in sentences — with scenarios priced, an action block whose expected value is checked by the server, and a track record of its own past reads.
- Open a name's drawer → click AI report →.
- Read the first paragraph, then the action block.
- If it says wait, the entry priced badly. Believe it.
- Scroll to the bottom for its track record on this name.
- Open it from the drawer's AI report →, the Report tab with a focused ticker, or Shift+Enter in the command palette.
- Glance at the facts strip under the header: the board the analyst was handed (trend ladder, changes, range position, volatility, positioning, sector rank, the next print, macro ahead), assembled by the server, never by the model.
- Read the picture, then what argues against it. Every evidence row says which way it cuts; a read with nothing against it never reaches you. The conviction meter names what sets it.
- Then the scenarios: one probability bar, then the table. The colour follows the money: an adverse scenario renders red even if the model called it a "target".
- Hover the chart for a bar's O/H/L/C/V/Δ and EMAs; the levels are tagged on the price axis. share ↗ posts it into a conversation with the read and the plan as its caption.
- Weigh the action block the way you weigh a card: its EV-at-entry is computed server-side, and a plan that prices negative is downgraded to wait before it reaches you.
- Check the track record at the bottom — every directional read is ledgered and graded out of sample like any signal.
- Regenerate only when something material changed; the button unlocks on a cooldown or on a moved mark, a fresh signal or a print.
- Reports are shared: the first person to generate one caches it for everyone. Generation is capped per person and per group per day, so do not spend it on a name nothing happened to.
- Sector and basket reports exist too:
report sector Semis,report basket AAPL MSFT NVDA. - It is a reading of numbers other tabs already show. If it cites something you cannot find on the board, that is a reason to trust it less, not more.
You type report HOOD. The picture: crowded long, funding at its monthly max, price pressing a level with three signals open. Scenarios priced. The action block says wait — the EV of entering here priced negative, so the server downgraded the plan before it reached you.
At the bottom: seven past reads on this name, five right.
So: you do not chase it into the meeting. The report did not tell you what will happen; it told you what the board already said, in sentences, and refused to dress up a bad entry.
20Notes
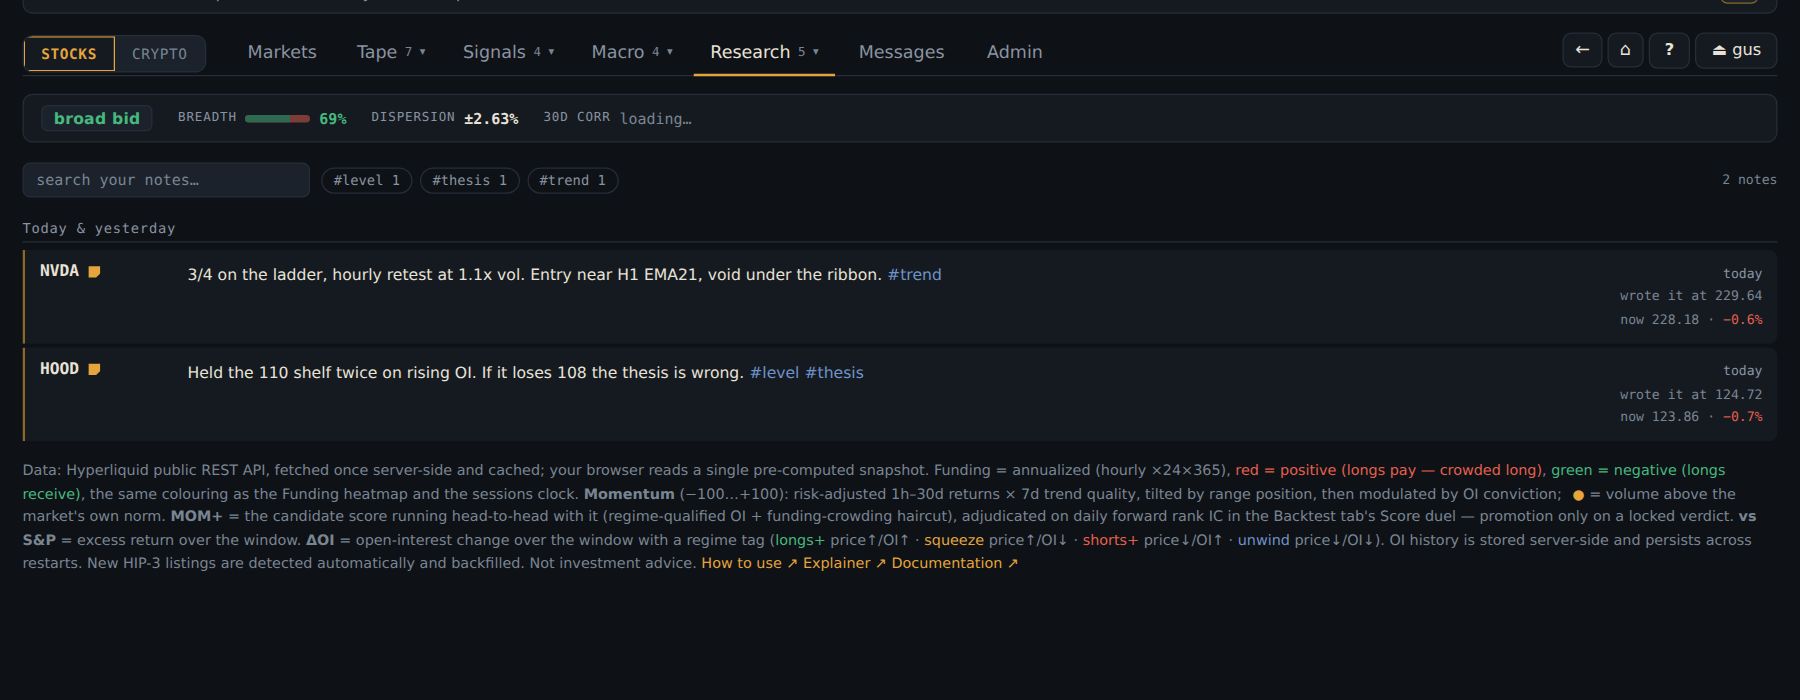
Your own thinking on a name, stamped with the price it was written at — so next month you read "wrote it at 113.90 · +4.0% since" instead of trying to remember what you meant.
- Open a name (click its row).
- In the drawer, click + note.
- Type what you think. Add a #tag if you like.
- Click save note. It is stamped with the price, forever.
- Find it later under Research → Notes.
- Open the drawer on a name and click + note in the Notes panel above the charts.
- Write what you actually think — a level, a reason, a rule for yourself. One honest line beats a paragraph of hedging.
- Tag it with
#tagsin the body:#thesis,#level,#mistake. Tags are read out of the text, so you never have to manage them. - Save. The note is stamped with the mark and the time, once.
- Find it again on the Notes taboperator-only by default — newest first, searchable over bodies and tickers, filterable by tag — or by the ◢ post-it in the Markets ticker cell (bright within a week, dimmer to a month, hollow after). ◢ noted in Filters narrows the table to names you have written on.
- Editing changes the words and nothing else. The timestamp and the price stand, and the edit is disclosed. If your view changed, write a new note — that is the record you will want.
- A name rotated out of the universe keeps its note, greyed and labelled.
- Writing needs the operator to have turned on note-writing for you; reading the tab never grants the pen.
- A call in Messages can be written into the notes book with one click, keeping its stamp.
Aug 30: you wrote on HOOD, at 113.90, "if it loses 108 the thesis is wrong". Sep 14 it is 121 and paying 58% funding; you write "not adding here".
A month later you re-read both. The first is +4.0% since, the second −2.5% since. The second call was the better one, and you can see it without remembering anything.
So: the note book becomes the one place your reasoning is stored at the price it was made — which is the only way to learn whether your reasoning is any good.
21Messages
A conversation where every call carries the price it was made at, forever. The group's shared record — with the board's own tables postable straight into the thread.
- Open Messages. Click a person or a group on the left.
- Type your message. Write tickers as $HOOD.
- For a short, write short $HOOD.
- Press Send. If it reads as a call, it asks once — Make the call or Send as a plain message.
- Type /top funding 5 to post a live table into the chat.
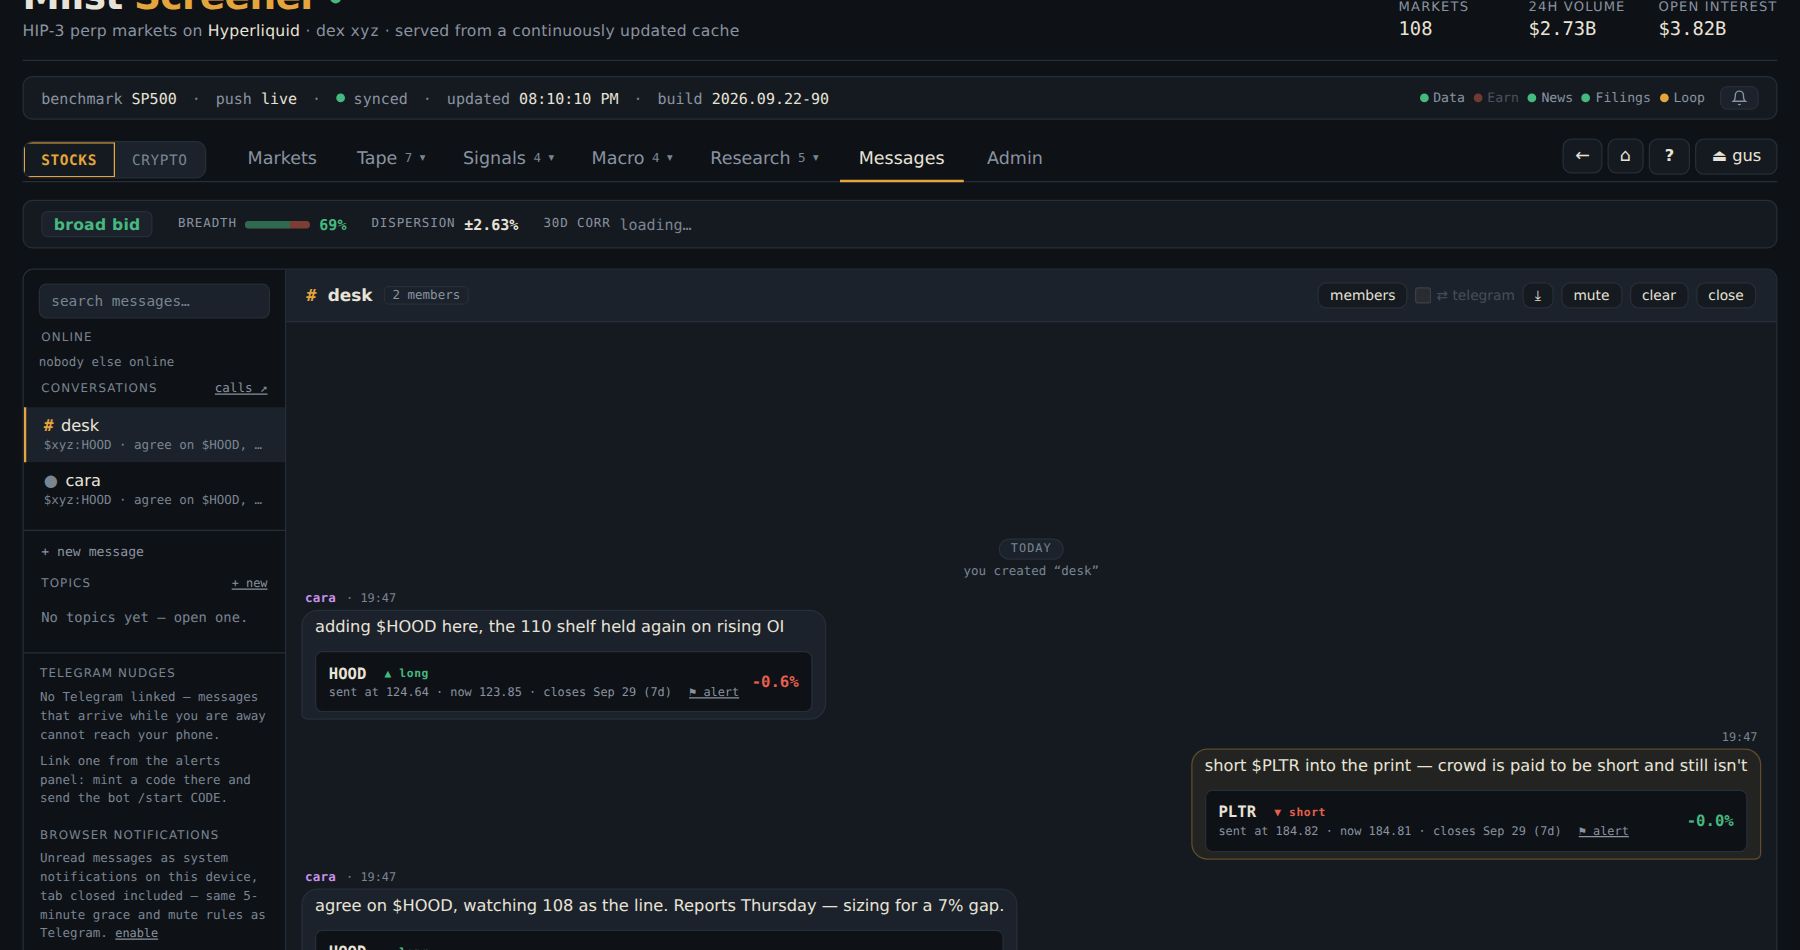 1
- 1calls ↗ — opens the Calls tab
$TICKER gets a card under the message: the price when it was sent, the price now, and the move since. short $PLTR is scored as a short.- Pick a conversation in the rail: a one-to-one with a member, a group, or a topic board anyone can join. Groups are created from the rail with a name; topic boards are standing posts for an idea, a ticker thesis, a theme.
- Name tickers with a dollar sign.
$HOODis stamped with the price at the moment you send it, and every later read shows the move since. Writeshort $HOODand it scores as a short;long $HOODorbuy $HOODas a long. Calls are public — the next section, Making a call, is worth reading before your first one. - Post a table instead of describing one.
/top funding 5,/nvda,/screen rvol>2,/earnings today— the result lands in the thread under your name, badged computed./helpshows you the verbs privately. - Share a piece of the board. Hover a cell on Markets for the ⤴ at its corner, hover the ticker cell for the row, right-click for cell · row · this screen, or press s on a highlighted row. The sheet previews the card, picks the conversation, takes a note, and can quote it as a call. The same ⤴ sits at the end of a row on Trend, Sectors and the other boards, on a Funding heatmap row, on every drawer section header and on each Charts pane (a chart goes as a picture). A shared screen can be live: everyone's copy re-runs your filters on their own snapshot, with newcomers marked and drop-outs struck through.
- Bind an alert to the conversation.
/alert NVDA > 200,/alert NVDA crosses down 180,/alert any rvol > 3— when it fires, the fire posts here./alert list,/alert off <id>. - Review the record. calls ↗ in the rail, or the record chip beside a caller's name on any call (rank · win rate · closed calls over 90 days), opens the Calls tab — the leaderboard, every call drawn on its candles, and each caller's profile. Deleting a call removes the words, never the stamp or the score.
- Escalation. An unread message reaches your linked Telegram after five minutes — unless you are online, or the thread is muted. An @mention or a message about a ticker on your watch list (the per-person list in the rail, separate from ★) goes immediately and pierces a mute.
- Telegram sync (⇄) in a conversation's header mirrors that one conversation both ways: every message lands on your phone as it happens, and plain text you send the bot posts here under your name. One conversation at a time.
- Browser notifications — enable them in the rail and unread messages arrive with the tab closed.
- Replies quote one line and click back; pins sit in a strip at the top; reactions are a small fixed set; drafts survive a reload; a conversation exports as JSON.
- Attachments: images and plain-text notes, checked by the server itself, not by what the file claims to be. Paste a screenshot straight into the box.
- A call can be armed as a price alert at its stamp — fires when the market crosses back through the level it was called at — or written into your notes book with one click.
- Your usage in the rail shows exactly what the operator can see about how you use the site (which tabs, how long — never what you typed or searched), and has a pause switch.
- The 📣 Calls recap topic posts the week's calls every Monday; join it from the rail if you want it in your list.
- 📣 Announcements, pinned at the top of the rail, is where the operator's broadcasts land — a note, a heads-up, a maintenance notice. It is read-only and yours alone; reply privately opens your DM with the sender, quoting it. A banner may show on every tab until you open it or press ×; mute alerts stops the push and Telegram copies, never the announcement itself.
- ↧ first unread on a rail row opens a conversation at the first message you have not read. With 15 or more unread, a one-line While you were away strip counts who posted, the calls made and closed, the tickers and links — plain counting, no AI.
- Lost the connection? A plain message is queued, not lost — queued — will send when back online, with a cancel — and goes out by itself when you are back, once. A call is never queued: it is stamped at the price when it reaches the server, so it is not sent later at a price you did not see.
- Under Browser notifications, all your devices… lists every browser that gets your notifications, each with a remove.
2pm: cara posts adding $HOOD here — stamped 113.90. gus answers short $PLTR into the print — stamped 151.30. Someone types /top funding 3 and the live table lands in the thread for everyone.
A week later both calls have closed at their 7-day horizon. The Calls tab shows cara +4.0% and gus −1.2%, each on the leaderboard with the rest of their record. Nobody has to remember prices, nobody can edit a call into a better one, and the group's record just accrues.
So: the chat is where the desk thinks out loud — and the stamps make it the desk's track record too.
22Making a call
A call says what you think, at what price, for how long — and then the site keeps score honestly, in public. The more your words commit to, the more the call counts.
- In any conversation, type short $HOOD to 98 by Oct 15 unless 118.
- Read the preview under the box: side, price, horizon, target, stop.
- Click + thesis. Write why, a catalyst, what would make it wrong, and a conviction 1–3.
- Press Send. The confirmation restates everything and lists the case against. Press Make the call (Enter).
- Later: + update while it runs, close call if you want out, write post-mortem once it has closed.
- The ticker — a
$TICKERmakes the message a call. A message with none, an edit, a command result or a shared card never asks. - The side —
short,sell,fade,bearish,putsand a few more make it a short;long/buya long. Options read as a trader would:buy $X putsis short,sell $X putsis long. If your words do not say, the confirmation asks which way? — a call without a side is not a call. - The horizon — right after the ticker:
$HOOD 30d,2w,next week,eom,by Oct 15. Unsaid, the confirmation offers 7 days or 30 days. The call closes at that day's close. - A target — a price and a deadline after the ticker:
$INTC to 32 by Oct 15, with an optional stop:unless 27. It resolves hit, missed or wrong (the stop came first). On a US stock a hit needs a touch in the cash session, or a 5-minute close through the level off-hours; a date deadline ends at that day's 16:00 ET close. - The preview names the word it read — "short because of “fade” · horizon from “by Oct 15”". If a target was refused (no deadline, on the wrong side of the mark) it sends as a plain call and the preview says why — never a wrong target.
- The confirmation argues back. Before a call goes on the record it lists the case against from numbers the app already shows: a crowded side, the carry it pays over the horizon, earnings inside it, a live signal the other way and its record, a trend it fades, a range extreme, the desk's open calls the other way. It never blocks the call — read it, then decide.
| Your words | Kind | Counts |
|---|---|---|
| long $HOOD | loose — no date, no target (a 7/30-day pick in the confirmation still leaves it loose) | ½ |
| long $HOOD 30d | dated — a horizon in the words | 1 |
| long $HOOD to 130 by Dec 18 | target — a price and a deadline | 1¼ |
The weight feeds the leaderboard's rank, its 8-call eligibility and the copy score's sample. Win rate and averages are plain.
- The thesis is sealed with the price. Why (up to 1,000 characters), a catalyst, "wrong if", conviction 1–3 — never editable, and it stays with the call if the message is deleted.
- + update appends a dated note while the call is open (up to 10). Nothing is rewritten.
- +7d extends the horizon a week at a time. It can never be shortened — that is what closing is for.
- close call (in the thread) or close now (on the Calls tab) locks the result at the live mark and asks why are you getting out? — the answer becomes the call's post-mortem. The record tags it ✋ closed by hand.
- write post-mortem — one per call, once it has closed. If your call had a thesis, you get one reminder on your phone within three days of the close.
- ⚑ alert on the stamp arms a price alert at the level you called.
- Max drawdown is on the record. How far a call went against you before it closed — a long at 80 that sank to 50 before hitting 100 reads max −37.5% against on its message, its chart and its result. A target hit after a deep drawdown is still a hit, and everyone can see what it cost.
You type HOOD looks toppy. No ticker, no call — just words. You rewrite: fade $HOOD to 98 by Oct 15 unless 118. The preview reads short because of “fade”, target 98, stop 118.
You add a thesis — "funding p95, OI still building, the print is priced for perfection", conviction 2 — and press Send. The confirmation restates it; Make the call. On Oct 9 it trades 97.60: the call resolves hit, posts its result into the thread under your name, and counts 1¼ on the board.
So: the extra ten words turned an opinion into a scored, weighted, falsifiable call — and the thesis is there for anyone who wants to follow the next one.
23The Calls tab
Every member's calls in one public record, scored the same way for everyone — so you can see who is actually good, at what, and whether copying them would have made money after costs.
- Open Signals → Calls. It opens on the Leaderboard.
- Pick a window: 30d, 90d or all.
- Click a caller for their profile and track record.
- Click any call to draw it on its candles.
- Press ☆ follow on someone worth following.
- Open Challenges to make this week's pick or start a duel.
| caller | closed | win | avg | vs bench | payoff | targets | copy | |
|---|---|---|---|---|---|---|---|---|
| cara | 48 | 65% | +2.1% | +1.4% | 1.6 | 7 · 3 · 1 | 72 | ☆ follow |
| gus | 31 | 58% | +0.9% | −0.2% | 1.2 | 2 · 4 · 0 | 51 | ☆ follow |
| dee | 5 | 80% | +3.8% | +2.9% | 2.4 | — | prov. |
- Leaderboard — one row per caller, scored on closed calls in the window, direction-adjusted, one unit per call. vs bench is the result minus the S&P 500 proxy (BTC for crypto) over the same hold — "did they beat just being long the market?". Fewer than 8 closed calls (weighted) is provisional: shown, never ranked. Any column re-sorts.
- Recent calls — every call, newest first. The public record: a call from a channel shows whole; a call from a DM shows the call and its thesis but not the words or who it was said to.
- By ticker — one market read like a chart: its candles on the Charts tab's axes, the record on the name, every caller's calls drawn with their paths in their own colour, a lane per call and the list beside it. Click a caller's chip to isolate them; hover the candles for a bar's prices.
- My copy portfolio — one paper $10,000 account copying everyone you follow, from the day you followed them, with fees and funding in.
- Insights — the open consensus (two or more callers on one market this week), the record of crowded vs lone calls, calibration (does a conviction-3 call really win more than a 1?) and a head-to-head between any two callers.
- Weekly recap — one week of the public record: who called what, the best and worst closes, the hand-closes with their reasons, how targets resolved, callers of the week. ◀ ▶ walk the weeks. The same recap posts to the 📣 Calls recap topic every Monday.
- Challenges — the weekly pick, head-to-head duels and custom contests (below). Games, not calls: none of them touches the leaderboard.
- Weekly: one pick a week, long or short, any market. Picks stay hidden until the week's first US cash open, everyone enters at that price and exits at the week's last close. The result posts to 📣 Calls recap, and a season table counts weeks won, weeks green and the total.
- Duels: challenge any member head to head. Choose the format — pick vs pick, same ticker, opposite sides, or return minus drawdown — the window (next session, a week, 2–10 sessions), the entry (the first cash open, or the live price once accepted), the markets, and an optional stop or max drawdown (a pick that goes that far against at any moment is knocked out and loses on the spot). The invite lands in your DM with them; they accept, decline or answer with new rules.
- Once a duel is accepted, nobody can cancel. The one way out is a draw by agreement, both of you asking inside the first 10% of the match. Each duel opens as a match card — both picks, the live % each side, who leads, a countdown and an optional trash-talk thread — and Share the card posts it as a picture. Results feed the duel ladder (an Elo rating from 1200), nothing else.
- Contests: any member can run one (three open at a time) from a fixed menu of rules — window, entry, markets (or a list of up to 20 tickers), side, 1–3 picks each, and the scoring: return, vs benchmark, return minus drawdown, least drawdown or first to +X%. You see the rules in words before you start. Up to 100 entrants; fewer than two at the lock is a void.
- Tiles, the curve against the benchmark, the spread of results, and breakdowns by side, conviction, thesis vs none, horizon, sector and ticker — with a finding where the numbers support one ("conviction is calibrated", "mostly the tape", "banks winners, rides losers").
- The track record, filterable; expand any call for its thesis, updates, post-mortem and result. ✋ marks a call closed by hand.
- The copy panel — what a follower would have made: $10,000 beside the caller's own record, entering 15 minutes late by default (0 / 1h / 1 day selectable), 5 bps a side plus funding.
- Click any call to draw it: the hold band, the entry at its exact minute and price, target and stop, the exit, and lettered pins where the Thesis, each Update and the PM post-mortem were written. 1D / 4H switch candles; vs overlays the benchmark rebased to the entry.
- The timeline beside the chart is a replay: pick an entry and every later candle greys out, so you see what the author saw when they wrote it. ← → step through.
- The header carries the call's max drawdown — how far it went against its side before it closed. The leaderboard's max dd is the mean over a caller's closed calls.
- share ⤴ in the header posts the chart exactly as it is on screen — replay step and benchmark included — into a conversation you pick, with the call's facts as its caption. A picture of a call, never a call: sharing it never stamps one under your name.
The ring beside each caller (0–100) answers "would copying this person have paid?" — a different question from "are they right?". Every public call of the last 180 days is replayed as a follower would have taken it: entered late, sized 10% of equity, fees and funding paid, total exposure capped. It weighs risk-adjusted return (50%), drawdown (20%), consistency (15%) and followability (15%) — how much of the edge survives an hour's delay. A caller who is right in the first five minutes and flat by the time you read it scores low, and should. Grey means provisional.
- ☆ follow sends a caller's next public call, with its thesis and copy score, to your Telegram and browser push (at most 4 an hour per caller). Never a DM's words.
- You can close your own open call from its row with close now — same dialog as in the thread.
- Calls made in a DM before calls went public stay with the two people in them and are off the public record.
Two members post a lot of calls. On the 90d board, dee is 4-for-5 and cara is 31-for-48. dee's win rate is higher; cara ranks first, because the lower bound on 48 calls is higher than on 5.
You open cara's profile: most of the edge is in shorts with a thesis, and "vs bench" is positive — it is not just the tape. The copy score is 72; the ladder shows the edge survives a 1h delay. cara's longs without a thesis are a coin flip.
So: you ☆ follow cara, and when the next short lands on your phone you read the thesis before anything else. You ignore the un-argued longs — the profile told you to.
24Your positions on the board
See what you actually hold next to what the board says about it — the ⬡ beside the ticker, a Position column, and a panel in the drawer with the trend read right beside your side.
- On Markets, click Filters.
- Paste your wallet's public address in the 0x… box. Click Link.
- A ⬡ appears next to every name you hold.
- Click ⬡ held to see only your book.
- Filters › Positions: paste your Hyperliquid wallet's public address and click Link.
- A ⬡ appears beside every name you hold, in the side's colour; the Position column shows side, notional at the live mark and the move since entry.
- ⬡ held in Filters narrows the table to your book.
- In the drawer, the Position panel shows size, entry, leverage, liquidation, margin, funding paid since open, and unrealised P&L and ROE off the live mark.
- Public address only. The app reads the public clearinghouse state and can never sign. It cannot trade for you, and nothing you paste here could let it.
- Your wallet is polled only while somebody is looking at it; the numbers you see move with the live mark between polls.
You link your wallet. A green ⬡ appears on HOOD (long) and a red one on PLTR (short). ⬡ held narrows the table to just those.
In the HOOD drawer the Position panel shows entry 109.20, liquidation 96.40, funding paid since open −$38 — and right beside it, the trend board reads 3/4 long. You are on the ladder's side. In PLTR you are being paid to be short: funding since open +$12.
So: one screen tells you where your risk is, what it is costing, and whether the board agrees with you — without opening the exchange.
25Book and What ifoperator-only by default
Your linked wallet read as one position — how much market risk it really carries, what it pays to hold, which legs are the same bet — and, before you add a trade, what that trade would do to it. Plus a journal that checks your own trades against what the board said when you took them.
- Link your wallet first (Your positions).
- Open Book. Read the risk line: per 1% of the S&P / BTC, funding next 7 days, 1-day VaR.
- Read one bet, several tickers.
- Press Import fills to start the journal.
- Before a new trade: What if I add this → on an Actionable card or in the drawer.
- Per 1% of the S&P / BTC is your book's beta in dollars: what a 1% move of the benchmark does to it (stocks against the S&P perp, crypto against BTC).
- Funding, next 7 days is what the book pays (red) or receives (green) at today's rates, with the 7-day average beside it and, where available, a projected week that lets each leg's rate drift back toward its average.
- 1-day swing and VaR: today's positions replayed over the last 60 days — one standard deviation of the daily P&L, the worst and best day, and the 95% VaR (the 5th-percentile day) with its expected shortfall. Risk share says which leg carries the swing.
- One bet, several tickers lists legs whose P&L moved together (ρ ≥ 0.7). Three of them is one position wearing three names.
- Journal: Import fills pulls the wallet's fills from Hyperliquid and folds them into trades. Each is tagged with what the board said when it opened — a live signal with or against it, whether you had a call on it, the funding it started paying — and the panels split your net P&L by those tags.
- Open it from an Actionable card's What if I add this →. It comes filled in from the card: side, entry at the live mark, the card's void as the stop, its target and horizon.
- Set your risk per trade (0.5% by default) and check the account equity (your wallet's, when one is linked). The stop is required: the size is worked out from it.
- Read the size, the leverage, the fill cost on the live order book, the funding over the horizon, and reward:risk net of fill and funding.
- Read your book before → after: VaR, expected shortfall, beta dollars, and whether the new leg joins a cluster you already hold.
- A calculation, never an order. The app is read-only; nothing here trades.
- The size is capped where the fill would cost more than your slippage ceiling (25bp by default) or run past the published book — and the panel says which.
- A stop on the wrong side of the entry, or zero equity, is refused with the reason — never a size. Exchange fees are not included; with no order book the fill cost reads unknown, never $0.
- Unlinking the wallet deletes the journal's fills; a different wallet starts a new journal.
You hold NVDA, AMD and AVGO longs and an Actionable card offers a MU long. Book already shows the three as one bet, several tickers, and $2,400 per 1% of the S&P.
What if I add this → on the MU card: at 0.5% risk against the card's void the size is $18,000, the fill costs 6bp, and reward:risk net of fill and funding is 2.1. But after, VaR goes from $3,100 to $4,050, and MU joins the same ρ ≥ 0.7 cluster.
So: the trade is fine on its own and bad for your book. You either take it at half size or close one of the three — and the journal will tell you later whether trading with the board's signals actually paid.
26Ask — the terminal and the palette
Any question the board can answer, answered in one line instead of a sort, a filter and a scroll — and a jump to any name or tab without touching the mouse.
- Press ~, or click ▸_ Ask at the bottom right.
- Type a ticker: nvda. Press Enter.
- Type top funding 5. Press Enter.
- Type a question in plain English: who reports tomorrow.
- Press Ctrl+K to jump to any name or tab.
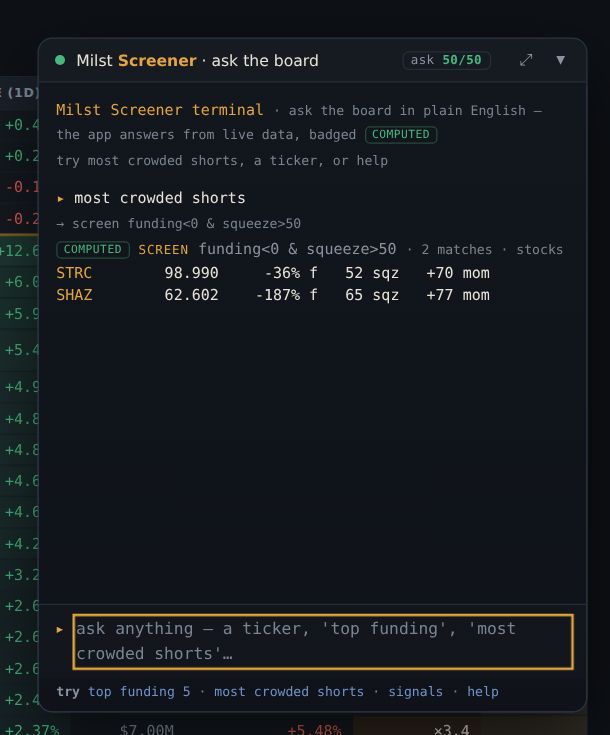 12
- 1type a question here
- 2the answer
- Ctrl/⌘+K, type a ticker or a tab name.
- Enter opens the drawer (or the tab). Shift+Enter opens the AI report for that ticker.
- Press ~ or click ▸_ Ask at the bottom right.
- Type a ticker for its card,
ticker fieldfor one number, or a verb:
| Type | Get |
|---|---|
| top funding 5 · bottom d7 10 | Any column ranked. Also gainers, losers, trending. |
| screen funding>20 & squeeze>50 | A filter across the board. Fields join with &. |
| breadth · sectors d7 | Tape health; sector performance over a window. |
| earnings tomorrow · news nvda 10 | Calendar and headlines. |
| vs nvda amd · corr nvda amd · diverge nvda | Compare two names; correlation and hedge β; a name decoupling from its benchmark. |
| comp … · ratio A/B 4h · report nvda | Opens the matching view. |
| whats above the 200dma · most crowded shorts | Plain English, translated into the grammar — the translation is echoed so you can learn it. |
- Tab completes verbs, fields and tickers. ↑ ↓ walk your history.
helpshows the verb card. - Plain-English aliases work:
apr→ funding,sqz→ squeeze,week→ d7,ytd→ vs year open,relvol→ rvol. - Anything the local grammar cannot parse goes to the AI leg, which is metered for the group. The ask chip shows what is left today. Local verbs never spend it.
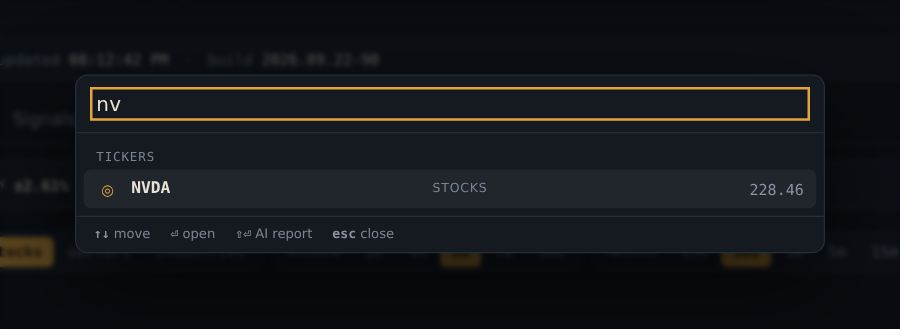
~ most crowded shorts → the ten most negative funding names. who reports tomorrow → the calendar slice. nvda vs amd → the two side by side.
So: the sort–filter–scroll loop for each of those would have taken a minute apiece. Learn five verbs and the board answers you instead of the other way round.
27Alerts and Telegram
You do not have to watch the screen. Tell the server what matters and it tells you — in the tab, on your phone, or as a morning brief.
- Click the 🔔 bell (top right, in the status line).
- Open RULES. Fill in: ticker · metric · above/below · number.
- Save. It watches for you, even with the tab closed.
- Open DELIVERY → link to get alerts on Telegram.
- Click the 🔔 bell in the status line, open Rules.
- Ticker (leave blank for any market) · metric · above / below · threshold. Thresholds are in
the metric's own unit:
5means 5%,50means 50M. - Save. It is evaluated on the server against the same snapshot the board renders, so it fires with no tab open. One crossing is one alert (there is a cooldown), and you can hold up to 60.
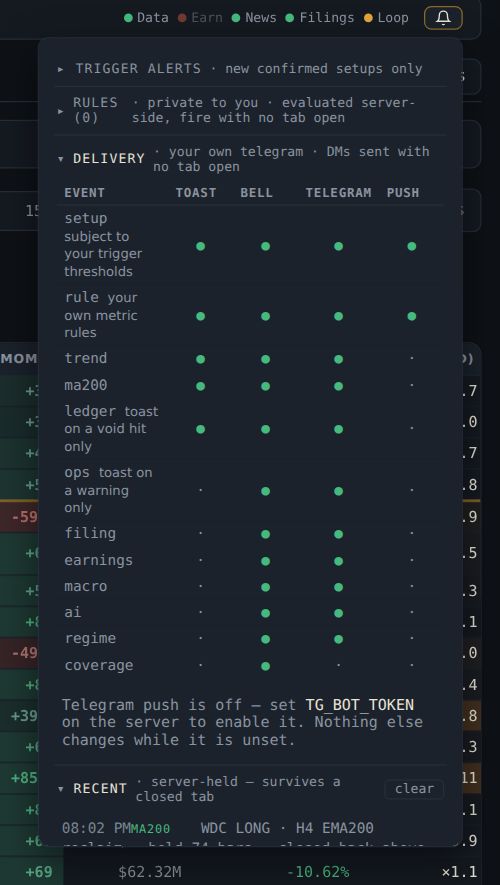 1
- 1the bell panel
any · relative volume · > 3 — something is being traded that is not normally traded.
NVDA · price · < 180 — your level, without staring at it.
any · ΔOI 1d · > 15 — money arrived somewhere today.
- Bell → Delivery → link. The panel shows a single-use code (ten minutes).
- Send
/start CODEto the deployment's bot. It replies Linked. - Pick the alert classes you want on your phone and set quiet hours (a local range like
23-7). test sends a probe.
- On by default: new setups on the actionable board (with your own EV / reward:risk / lateness thresholds and per-name mutes), ledger outcomes (a void taken, a target reached, a horizon resolved), your rules, and calls — from people you follow, and your own calls' results.
- Opt in: new signals (fast) — a Signals card the moment it opens, with its side, void, target and score, before any track record is required (Act tier only unless you widen it; your signal score ≥, 55 by default, applies; Pop up new signals shows them in the tab too) — trend changes, 200- and 50-EMA closes and touches, new price levels, funding extremes (a name at the far tail of its own funding history), open-interest caps (a market hits its cap, so new money is locked out, or comes off it), tape-wide crowding, material SEC filings and 13Fs, insider cluster buys (three or more insiders buying within 10 days), congress trades, earnings, macro prints, a flipped AI stance, and the Focus list at the open. Each shows how often it actually fires, so you can judge the noise before you subscribe.
- You only see what you can use. A class belongs to its tab: if the BOW, Congress or Insiders tab is not open to you, its alerts are neither offered in the panel nor sent to you. Rule metrics follow the same rule (trend score needs Trend, days to earnings the Calendar).
- Scheduled sends: the morning brief (daily, at your hour), the Landscape commentary a few times a week, and a desk digest — open calls with their levels and close dates, the calls closed this week, the 30-day record per person with copy scores, the open consensus, the newest signals, earnings today and the day's movers. The digest has no default hour: nothing sends until you pick one. Set the hour and the days per send.
- Calls reach you too: a caller you ☆ follow on the Calls tab sends their next public call to your Telegram and browser push; a call of yours that resolves a target posts its result into the conversation it was made in; and a closed call with a thesis nudges you once to write its post-mortem.
- Where the BOW and Pulse tabs are open to you, opt in to BOW signals and/or Pulse signals (both are off by default). The bell's BOW & Pulse section then sets them up, one engine at a time.
- Pick the events — a new leg, a flip, a stack (×N), a leg closed by a call — the timeframes (4h, 12h, 1D, 3D), the lowest score (BOW 80, 90, 95 or 100; Pulse 80, 90 or 100) and the direction.
- Left alone it is the quiet set: new legs and flips, every timeframe, BOW 90+ and Pulse 80+, both directions. The section previews how many of the server's recent BOW / Pulse alerts your choice would have let through.
- BOW alerts on a call's first report; Pulse only once it is confirmed. One call is one alert.
- The message says what the call did to its leg — opened it, stacked on it, or flipped it, with the move and length of the leg it closed.
- Your choice is saved to your account, so the bell, the pop-up, your phone and your webhooks all follow the same filter. Partial-coverage calls never alert.
- Recent in the bell is the server's own record — it survives a refresh, a closed tab and a redeploy. Clearing it only hides it in this browser.
- Delivery is paced (a message every few seconds, a cap per hour): held, not dropped, and disclosed in the panel.
/stopto the bot unlinks, always — control of the Telegram account outranks any session.
You write two rules: HOOD · price · < 108 (the level your own note said would void the thesis) and any · funding percentile · > 90. You link Telegram, quiet hours 23-7.
Wednesday 3:12pm, phone buzzes: HOOD 107.80 < 108. You are not watching the screen. You do what you said you would do three weeks ago, at the price you said.
So: the rule turned a plan into an action, and the funding-percentile rule keeps handing you the crowded-trade names without you hunting for them.
28On a phone
The same site, installed as an app, with a column set that fits the screen and notifications that work with it closed.
- Open the site on your phone.
- Browser menu → Add to home screen.
- Accept the phone column preset.
- In Messages, click enable under browser notifications.
- Install it: browser menu → Add to home screen.
- Accept the mobile preset the first time (ticker, price, 24h, 7d, funding, ΔOI, volume). Every other column is one toggle away in Columns, and once you arrange it yourself the app never overrides you.
- Keep a phone layout. Which layout is active is per device by design, so save one called phone and leave it.
- Turn on notifications in the Messages rail for unread messages with the tab closed, and link Telegram in the bell for alerts.
- Your watchlist and saved layouts are already there — they follow the account.
- The Trend table scrolls sideways inside itself rather than widening the page; EMA Touch puts the Touches feed first; BOW and Pulse turn into one column of cards with a Filters panel.
- On Charts, press and hold for the crosshair and tap twice to draw; the toolbar folds behind ⚙.
- Nothing is cached on the device on purpose, so you are never looking at yesterday's page.
You open the app from the home screen. ★ only is on, the phone layout shows ticker, price, 24h, funding, ΔOI. The bell has a badge: a setup fired on a starred name.
Tap the alert → the drawer → event risk clear, funding fine, note from last week says the level to watch. You decide, and put the phone away.
So: the same numbers as the desk, sized for a thumb, with the decision already framed by what you wrote last time.
29Ten habits that make it pay
- Check the window before you react to a number. Most "that can't be right" moments are a window you forgot you set.
- Hover before you conclude. The sample size and the inputs are one hover away on every cell.
- Sort by vs tape, not by 24h. Relative strength on a red day is the read that matters.
- Read n before score on every signal card.
- Search a name's claim history before you trust a card on it.
- Look at the funding heatmap before you hold anything overnight. Carry is a cost you can see coming.
- Check correlation before you add a name. The third chip stock is not a third idea.
- Write the note now, at the price — and give every call a date or a target and a thesis. Future you will read it with the move since; the board will count it in full.
- Let rules watch levels so you do not have to.
- Trust the record, read the card. The out-of-sample ledger is the part of this site that cannot flatter you.
Where to go from here
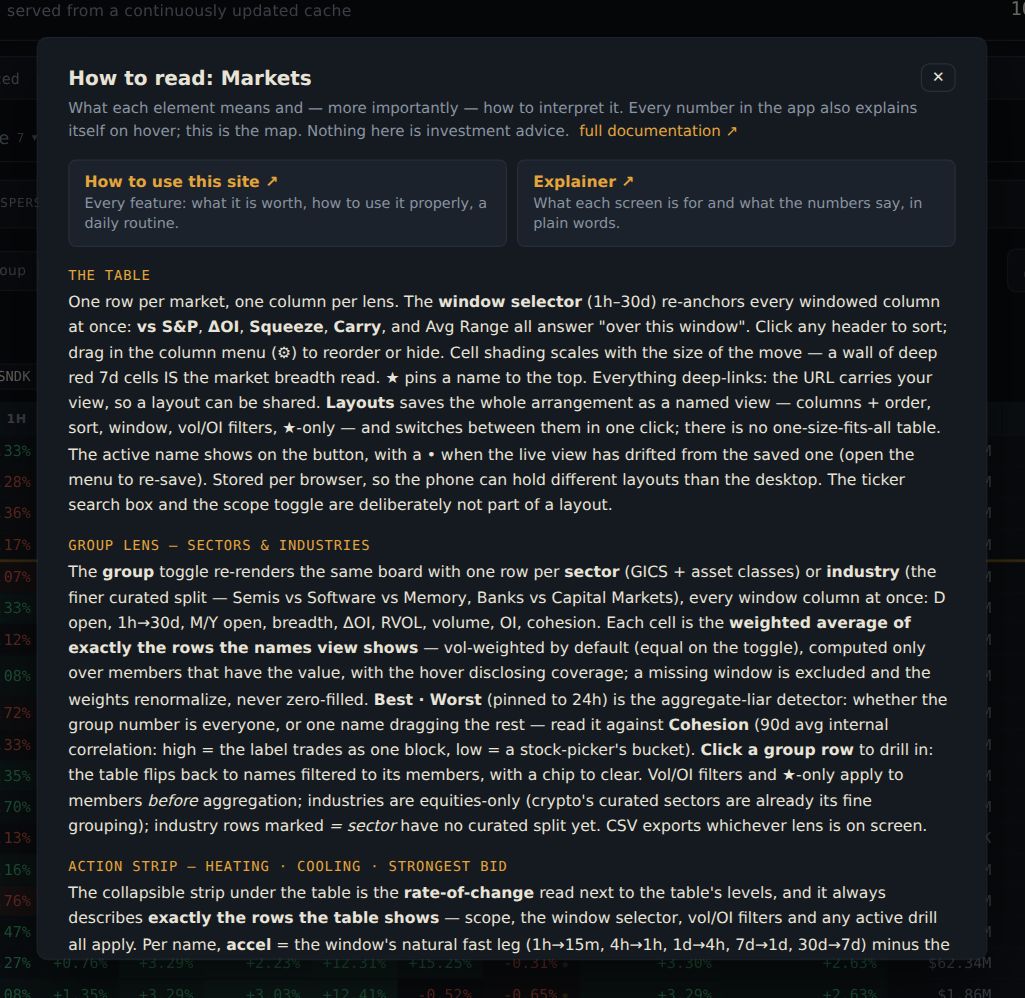 12
- 1the two guides
- 2how to read this tab
- The explainer — the ideas behind the screens, in one read.
- The complete manual — the exact definition of every column, control and alert. Press ? on any tab for the section that matches it.